
How to Track SMED Changeover Times with Real Machine Data
Learn how to use technology to measure and track SMED changeover times with reliable machine data. Identify your priority setups, analyze the machine stops tied to them, and confirm that improvements hold and help raise availability and OEE.

Content
Applying SMED to processes with frequent changeovers helps you reduce setup-related downtime, recover productive time, and improve availability, one of the three components of OEE. Not every changeover offers the same opportunity or impact on results, though. To decide where to act first, prioritize:
- Setups on critical machines or processes
- Frequent or long changeovers
- Setups with the most accumulated downtime
- Changeovers with high variability from one run to the next
- Setups that affect the production schedule
Technology can make this evaluation easier, as long as it delivers reliable data and connects changeover times to their impact on operations.
Why does SMED need reliable machine data?
Measuring a setup is more than recording how long it takes. To compare results and prove improvement, measure every event the same way.
Your team should define what marks the start and end of a setup. If one shift starts timing from the last good part and another starts when the machine stops, the results don't describe the same process. Technology can record machine states and times automatically, but your industrial plant sets the measurement standard.
You also need to separate setups from other downtime causes. Changeovers usually count as planned downtime, but they shouldn't be grouped with different activities such as maintenance, cleaning, or material shortages. Clear classification shows you how much stopped time really comes from changeovers.
Beyond the duration of each setup, it's worth analyzing:
- Frequency of each setup type
- Accumulated downtime
- Variation between runs
- The related machine, line, shift, or product
- Effect on availability and OEE
Reducing changeover times: what's the role of machine data?
Machine data should help you decide where to act and confirm whether your actions are working. The first step is setting a baseline with comparable events: the same changeover type, machine, product, or operating conditions.
With that baseline, your team can see which setups lose the most time, where variability is highest, and which shifts or machines get the best results. These differences guide direct observation on the shop floor and help you find practices worth standardizing.
After you make a change, compare the new result against the baseline. One shorter setup on its own isn't enough. Check whether the reduction holds across several runs, shifts, and products, not just in the average.
It also helps to look beyond individual setup time. When setups are part of planned production time, shorter setups can raise availability and improve OEE. Your analysis should show whether the initiative recovered productive time and meaningfully improved process performance.
Technology doesn't replace watching the setup, and it doesn't decide which activities to make external, simplify, or eliminate. Its role is to provide the evidence and precise data from your machines and processes so you can prioritize opportunities and verify results.
What features should a tool have to support SMED and quick changeovers?
To support SMED and quick changeovers, a technology or tool should include features such as:
- Downtime cause classification: separates planned from unplanned downtime and classifies each event using your factory's own categories. The team can confirm the cause with added context when needed.
- Machine downtime tracking with automatic data and time capture: detects when a machine stops, changes state, and starts producing again, without relying on observation or after-the-fact records.
- Historical data and comparisons: lets you compare setups by machine, line, shift, product, or time period and measure the results of your actions.
- Dashboards and reports you can set up: show setup duration, frequency, variability, and accumulated time without rebuilding the data in spreadsheets.
- Downtime alerts: notify your team when a setup runs past the defined range. Alerts make follow-up easier, but they don't correct the process on their own.
How do you compare machine downtime tracking solutions for measuring setup times?
Two tracking solutions can both offer dashboards, reports, and alerts and still deliver very different results in daily operations. To compare them, review these criteria.
Machine data reliability and usefulness
Confirm that the recorded states, cycles, and times match what the machine is actually doing. You should be able to segment the data by product, shift, and downtime cause. The platform should present information that helps you prioritize, compare, and follow up.
Ease of adoption on the shop floor
Dashboards and digital Andons should be simple for the whole shop floor team. If they require too much manual work or specialized knowledge, it will be hard to keep people using them.
Scalability and connectivity
Check whether the solution can start with one critical process and expand to other machines, lines, or plants. Also check whether it connects through APIs and works alongside your ERP, MES, CMMS, and other systems.
Implementation, training, and support
Ask how long installation takes, how much involvement it requires from your team, and how the KPIs and downtime causes will be set up. Training and support are what keep a tool in use over time.
Keep in mind that technology complements SMED and other Lean Manufacturing tools. It doesn't replace direct observation, standard work, or the involvement of the people who perform the changeover. It also doesn't identify the root cause on its own. Your team interprets the data and decides what actions to take.
How Pulsar helps you measure and track SMED changeover times
Pulsar automatically monitors machine states, planned and unplanned downtime, production, cycles, availability, OEE, and over 25 key metrics. With external data capture devices and industrial sensors, Pulsar connects machines of different brands and generations without touching their PLCs, enabling automated machine downtime tracking.
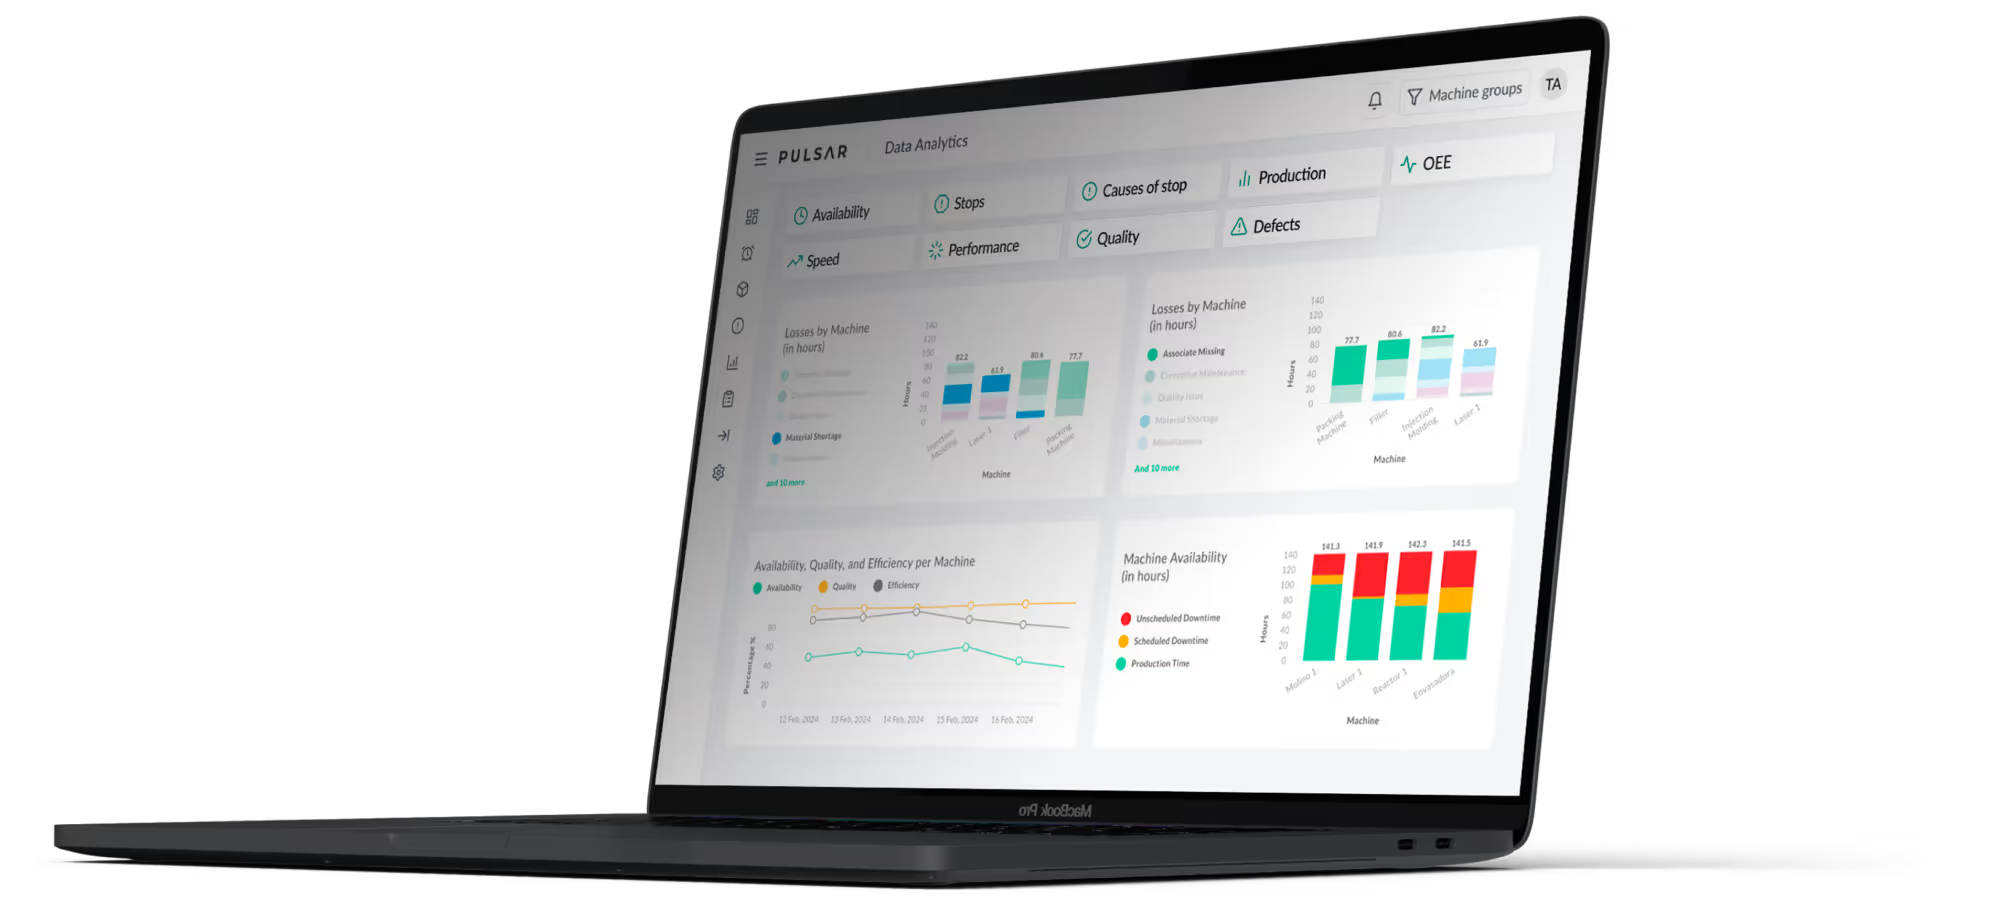
Pulsar's dashboards, historical reports, and alerts help you separate setups from other machine stops, compare their behavior, and confirm that reductions hold over time. Pulsar provides the data. Your team uses it to analyze the process and implement improvements.
Explore our platform

Frequently asked questions
How can I reduce changeover times with precise machine data and technology?
Technology helps you to measure so you can improve. To reduce changeover times, you need consistent changeover times data. Example: start and end criteria for measurement, the duration and frequency of each setup, accumulated machine downtime, and context such as machine, shift, and product. You should also record how each machine stop is classified. It is also important to set a baseline to compare results after adjusting the changeover process and determine whether the impact was positive or negative.
What features should a tool have to support SMED and quick changeovers?
It should offer automatic data capture, downtime classification, historical data, comparisons, dashboards, reports, and alerts you can set up. It should also work with your existing machines, connect with other systems, and come with implementation support. Schedule a demo to see how Pulsar can help you track your SMED initiatives.
How do you know if a setup time reduction is holding?
Start by comparing your improved results against the baseline over a representative period. Check whether the new time holds across runs, shifts, and products, not just in the average.
Related articles

Request a Custom Demo
See how Pulsar’s manufacturing intelligence platform can help your operations today.