
Manufacturing KPIs and Real-Time Alerts
Real-time monitoring lets you go beyond checking dashboards and spot when a condition needs attention. In this article, you'll learn how alerts help you identify anomalies in efficiency, performance, production, cycle times, and machine condition, and how this approach strengthens visibility in a visual factory.

Content
Monitoring a manufacturing facility shouldn't depend on a supervisor constantly reviewing dozens of manufacturing KPIs to find out what changed. In operations with multiple machines, lines, and shifts, an anomaly can go unnoticed even when the data is already on a KPI dashboard.
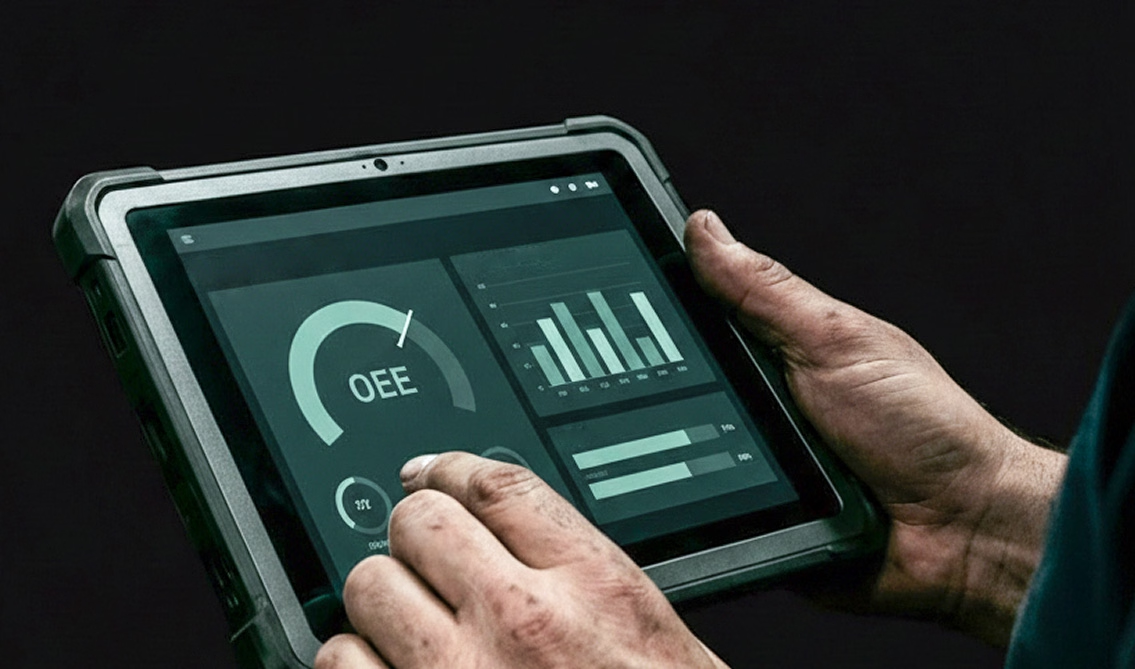
Key performance metrics for manufacturing, like OEE, downtime, speed, and production, need close attention when efficiency and production goals are on the line. Real-time monitoring with anomaly alerts changes how you track them. Instead of constantly checking your KPIs, your team gets notified when a condition needs attention. Alerts don’t replace your team’s analysis, and they don’t run the process. Their job is to make what’s happening on the shop floor visible and help you set priorities.
Having KPIs isn't the same as knowing when something changes
Manufacturing dashboards or reports can bring together different production KPIs. But it still depends on someone checking them and catching unexpected behavior in time.
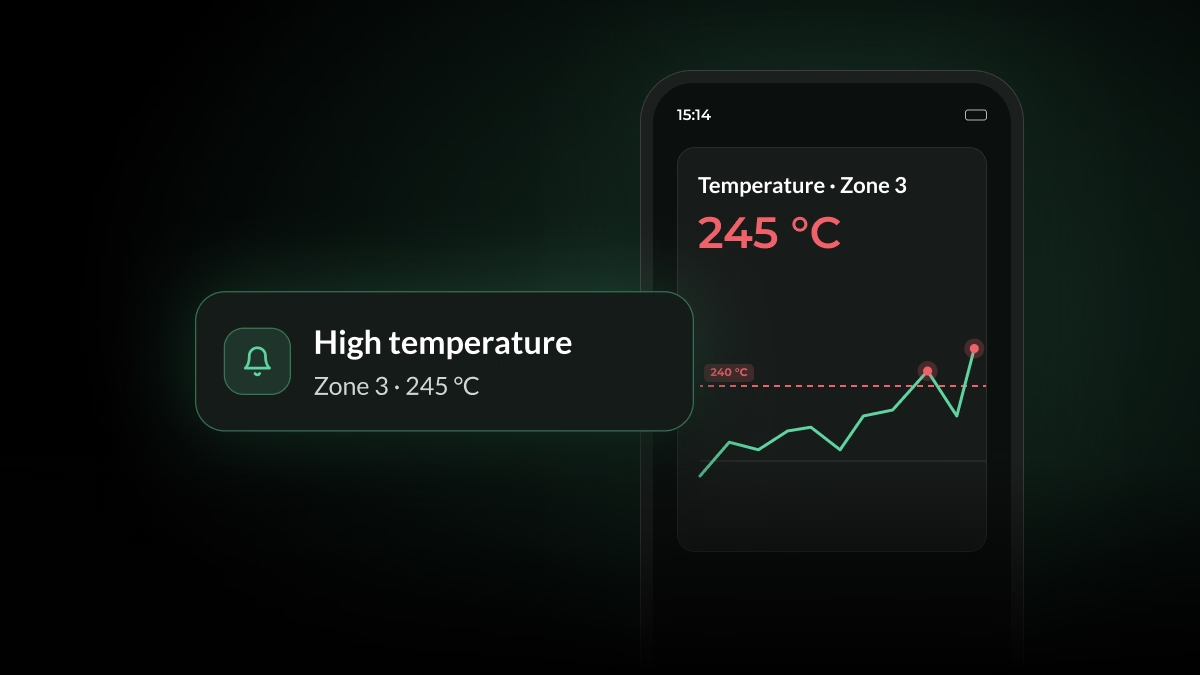
Alerts add a different layer of visibility. Supervisors don't have to keep walking the shop floor and reviewing machines and metrics to stay informed. Instead, alerts point out when a specific condition deserves attention. Alerts can appear on a dashboard, or can be sent via SMS, WhatsApp, or directly to phones as a push notification.
This is especially useful when an anomaly doesn't cause an obvious interruption. A machine can keep running while it loses speed, gradually increases its cycle time, or drops in performance.
In other words, the value isn't just in having the data available. It's in knowing exactly when that data changes in a way that matters to your operation.
What can an alert reveal about your manufacturing KPIs?
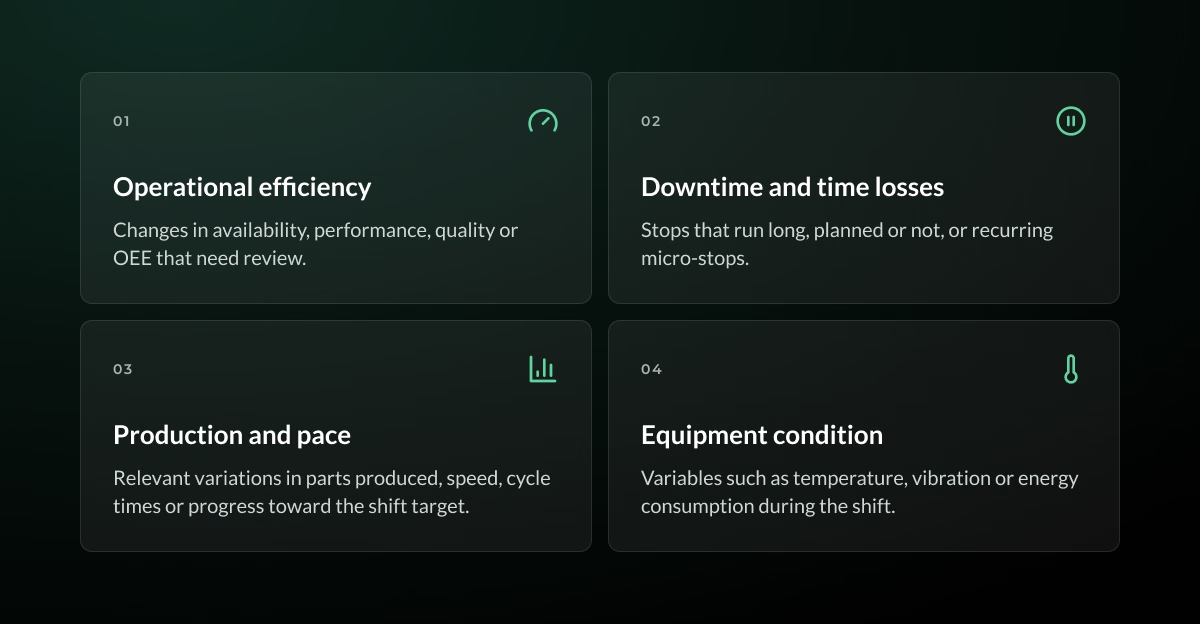
Alerts help you pinpoint changes across different dimensions of your factory's operation. For example:
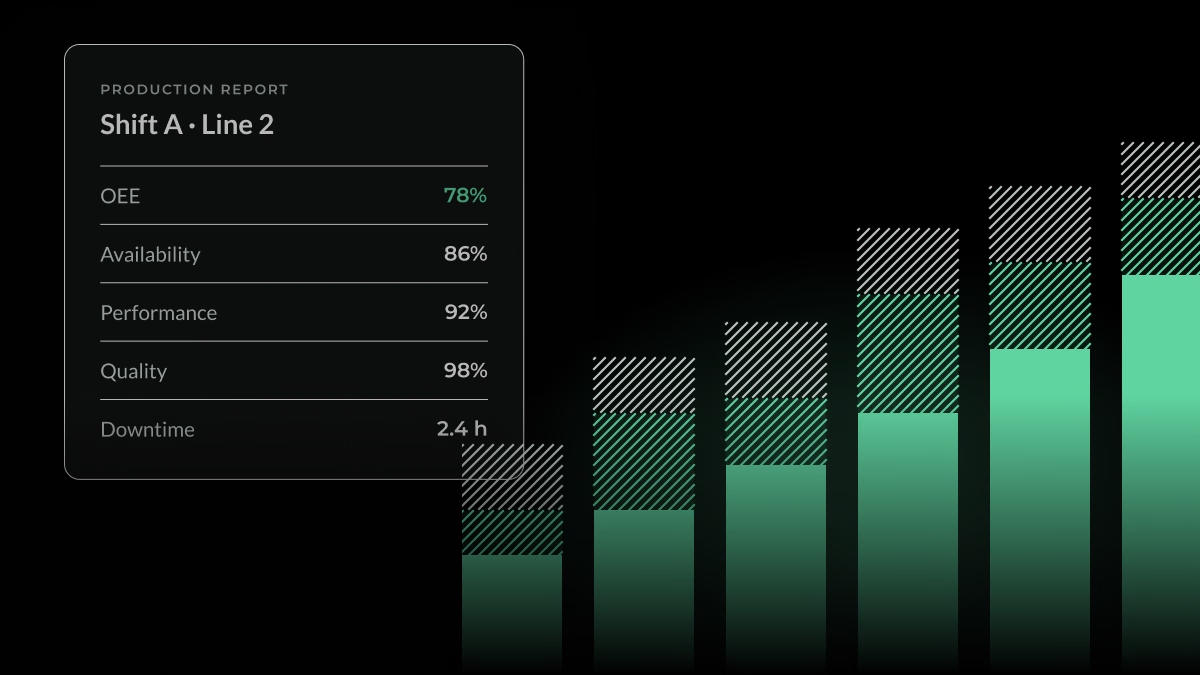
- Operational efficiency: an alert can flag changes in availability, performance, quality, or OEE that need review.
- Downtime and lost time: it can surface machine stops that run longer than expected, planned or unplanned, as well as recurring micro-stops.
- Production and pace: relevant variations can show up in parts produced, speed, cycle times, or progress against the shift target.
- Machine condition: you can track variables such as temperature, vibration, or energy consumption throughout the shift.
From reacting to machine stops to detecting anomalies during the operation
A machine doesn't need to stop completely for something to need attention. Cycle time can start rising steadily. Speed can drop below its usual level, or more defects than normal can appear.
You may also see changes in other metrics such as temperature, energy consumption, or vibration patterns that are worth a review by your team.
That's why limiting alerts to the question "Is the machine stopped?" leaves out an important part of how the process behaves.
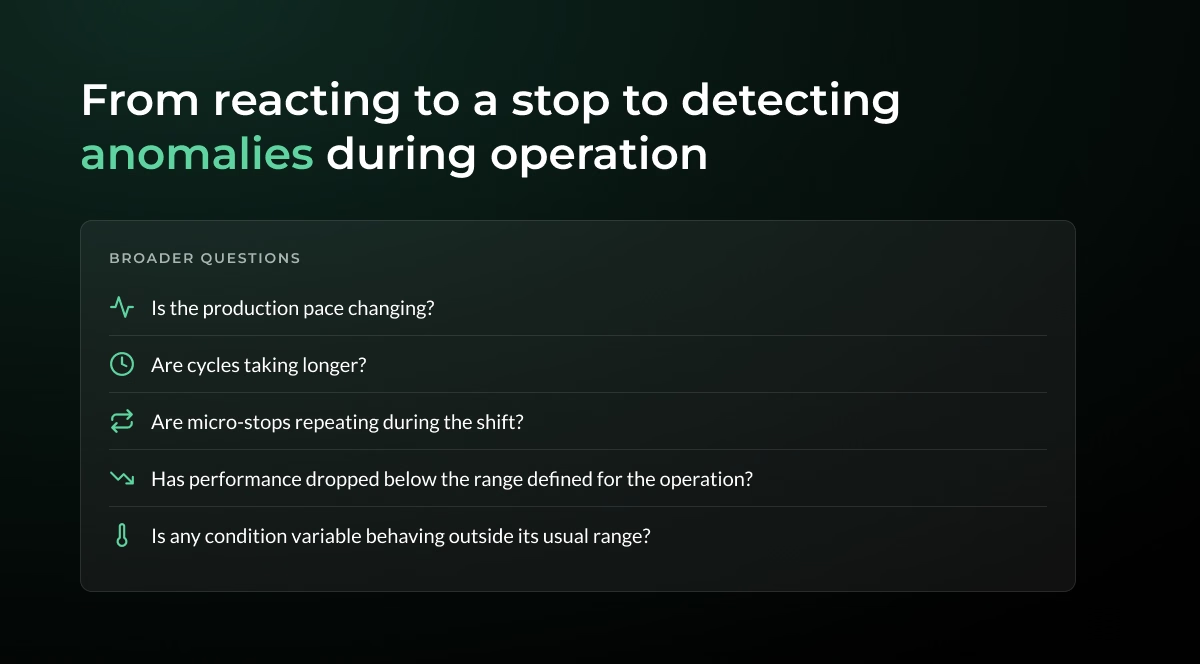
Real-time monitoring with alerts helps you ask broader questions:
- Is the production pace changing?
- Are cycles taking longer?
- Are machine stops repeating throughout the shift?
- Has performance dropped below the range set for the operation?
- Is any condition variable behaving outside its usual range?
An alert tailored to your operation won't automatically explain the cause. It does make the anomaly visible, so your team can compare with other metrics and analyze it with the right context. It also helps you tell "normal" machine stops apart from the ones that aren't.
Real-time alerts as the foundation of a visual factory
In a visual factory, supervisors and teams can see the status of the operation and any condition that needs attention, without relying on late reports or individual checks. For manufacturing companies that want to make decisions faster, real-time alerts are a good place to start.
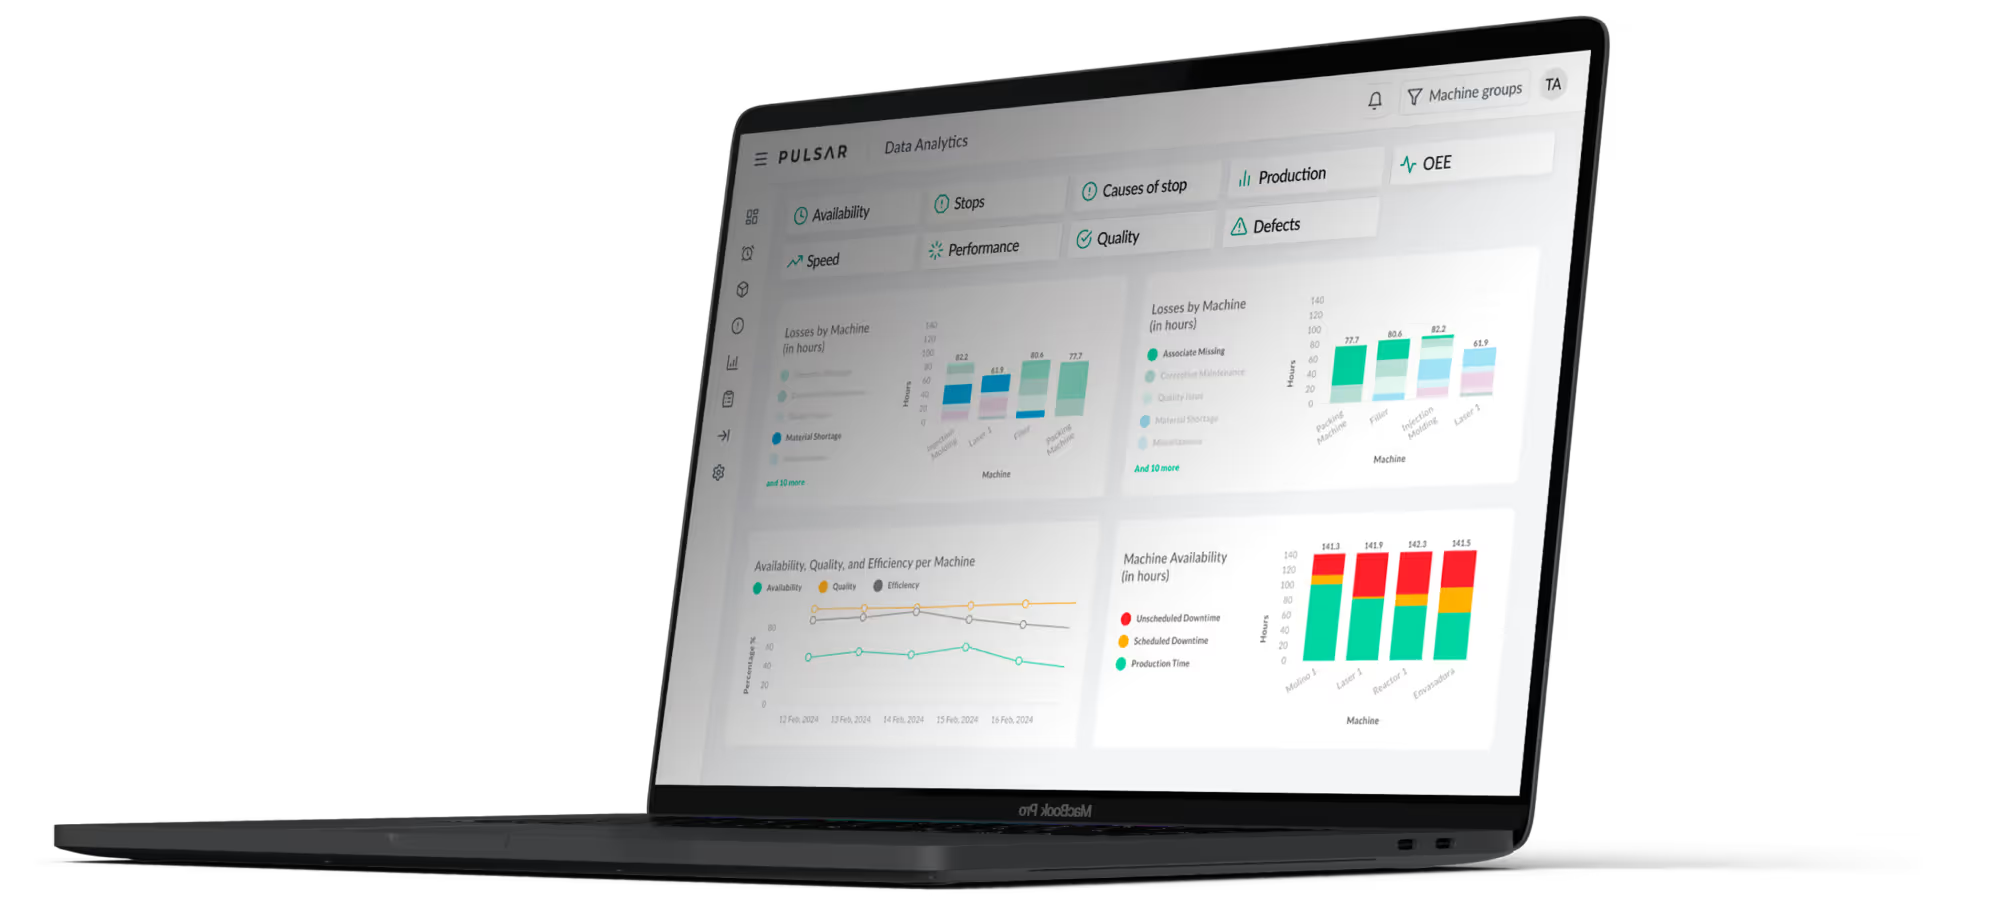
KPI dashboards help you see the overall status of machines and lines. Alerts complement that information by showing which condition deserves attention at any given moment.
This visibility also gives you a stronger foundation for process optimization.
How does Pulsar bring smart alerts to manufacturing KPIs?
Pulsar is a monitoring and smart manufacturing platform. It centralizes data from machines and processes and turns it into KPIs, dashboards, historical data, reports, and alerts.
The platform monitors over 25 industrial metrics, so you can see different dimensions of your operation in real time.
Smart alerts are one of Pulsar's main innovations. They go beyond a focus mainly on machine stops and give you broader visibility into the KPIs your industry needs.
Pulsar combines several layers of information. Real-time monitoring shows you the current status. Smart alerts flag anomalies and can reach your mobile devices. Dashboards and historical data help you understand the context. Together, they make relevant changes in your operation visible, so your team can focus on where an anomaly exists and analyze it against historical data.
See how Pulsar works. Book a demo here.

Frequently asked questions
Which manufacturing KPIs should you monitor in real time?
It depends on your process and your plant's priorities. OEE, production, planned and unplanned downtime, speed, cycle times, availability, performance, quality, and certain condition variables tend to be especially useful when their changes need attention during the shift.
What's the difference between monitoring a KPI and getting an alert?
Monitoring means having the data available. An alert tells you when that KPI shows a condition that needs review, so you don't have to rely only on checking KPI dashboards manually. Alerts can also reach mobile devices through channels that make the information stand out visually.
What kinds of irregularities can you detect in an industrial plant?
Besides machine stops, you can catch changes in OEE, availability, speed, performance, cycle times, quality, energy consumption, temperature, vibration, or other available variables.
How do real-time alerts support a visual factory?
They make visible what needs attention. This helps your team keep track of all the KPIs in the operation without depending only on routine checks.
Do smart alerts automatically identify the cause of a problem?
No. An alert makes an anomaly visible. Finding the root cause is up to your team, supported by historical data, operational context, and continuous improvement methodologies.
Related articles
Request a Custom Demo
See how Pulsar’s manufacturing intelligence platform can help your operations today.