Tracking What Matters: Real-time KPIs for the Manufacturing Industry
The right KPIs for manufacturing industry keep your company efficient and competitive. Use machine tracking in real time to capture the metrics that matter, performance, production, quality, and downtime, so your team can optimize processes and make data-driven decisions.
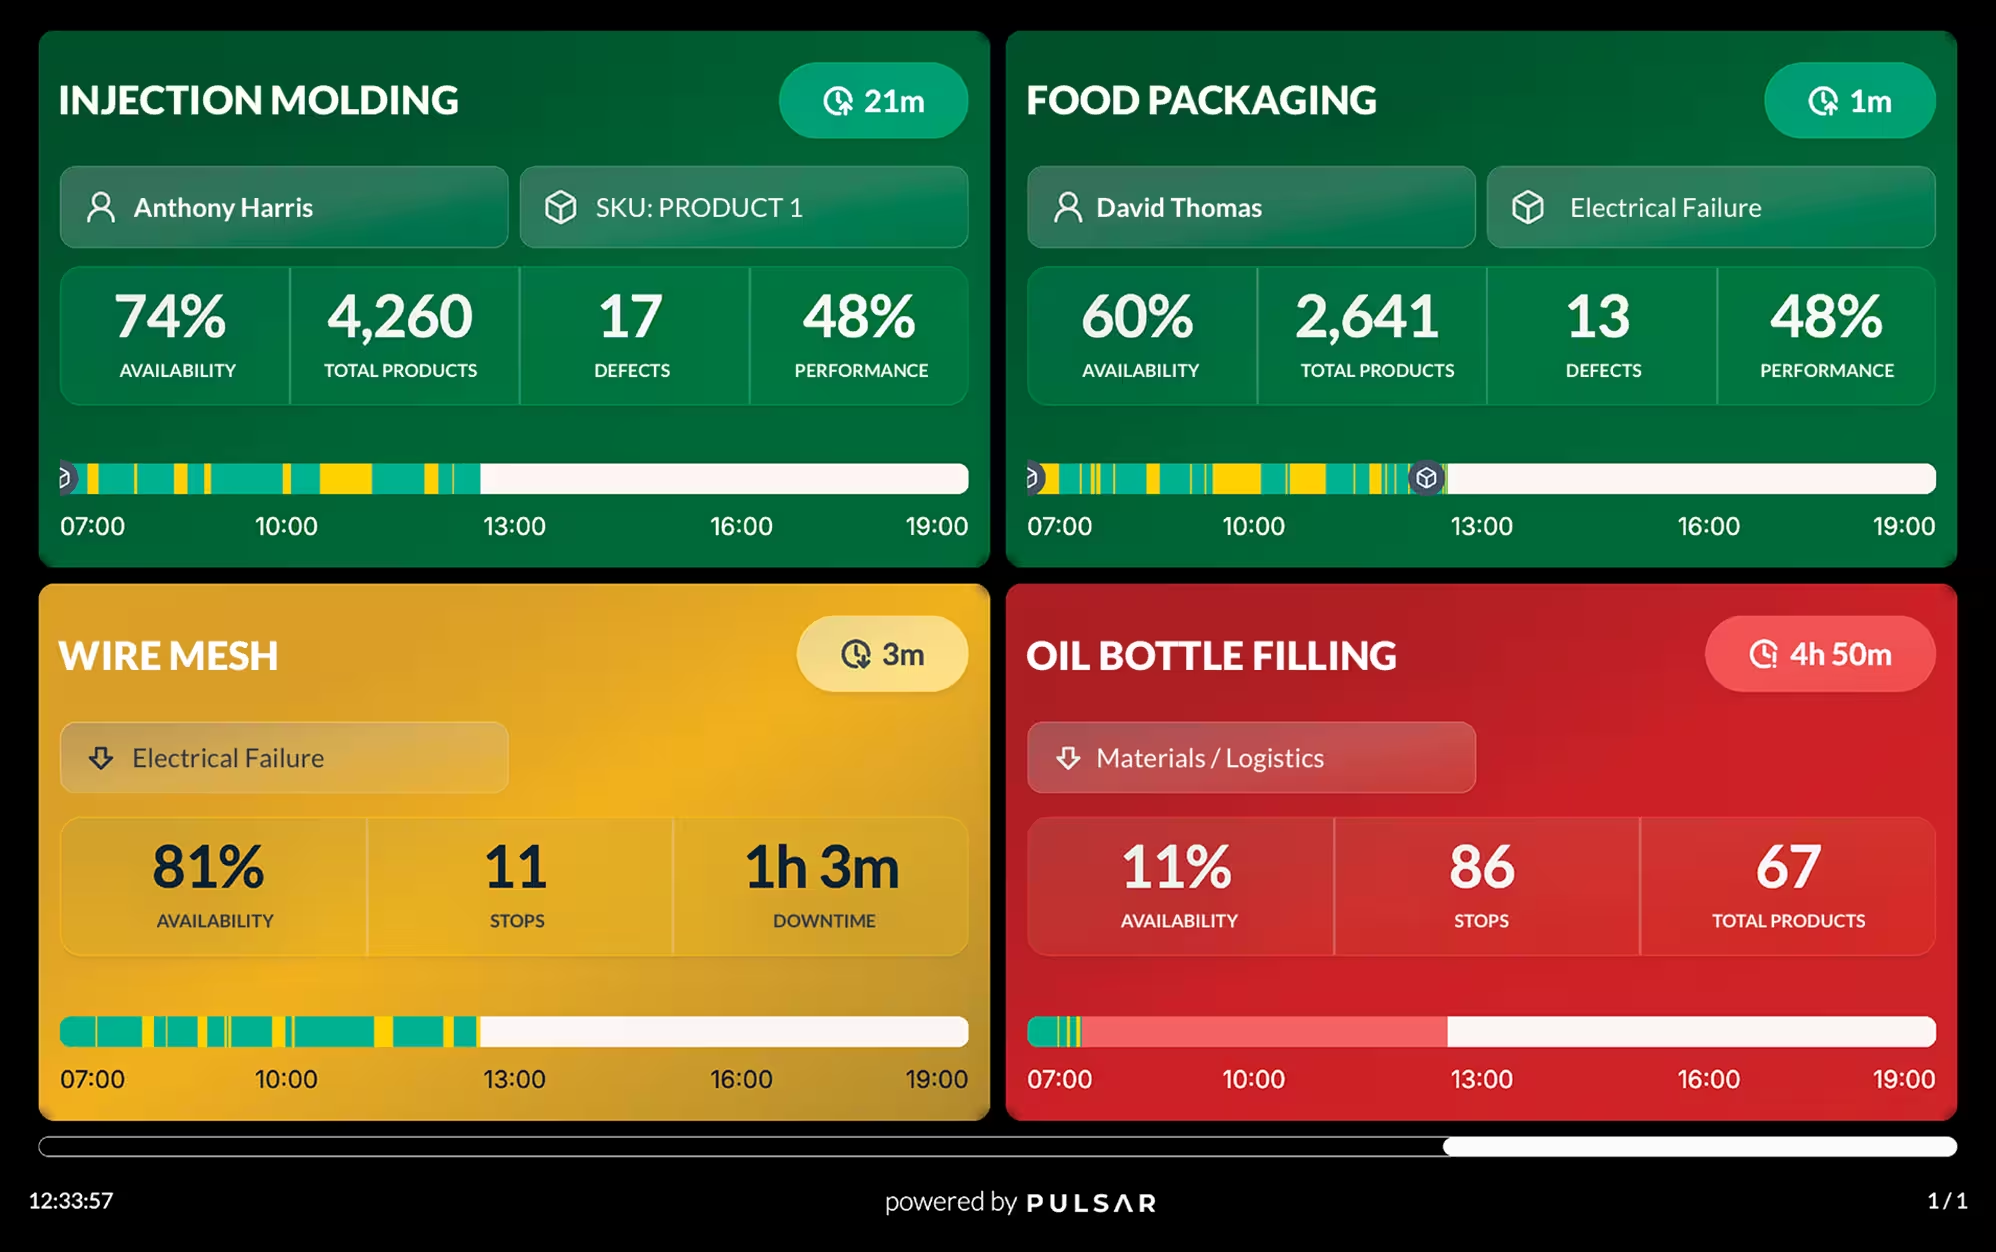

Machine tracking for manufacturing KPIs in real time
Pulsar centralizes your indicators on a single platform to generate reliable production reports, simplify production management, and drive manufacturing optimization.
Monitor your machines from a single platform
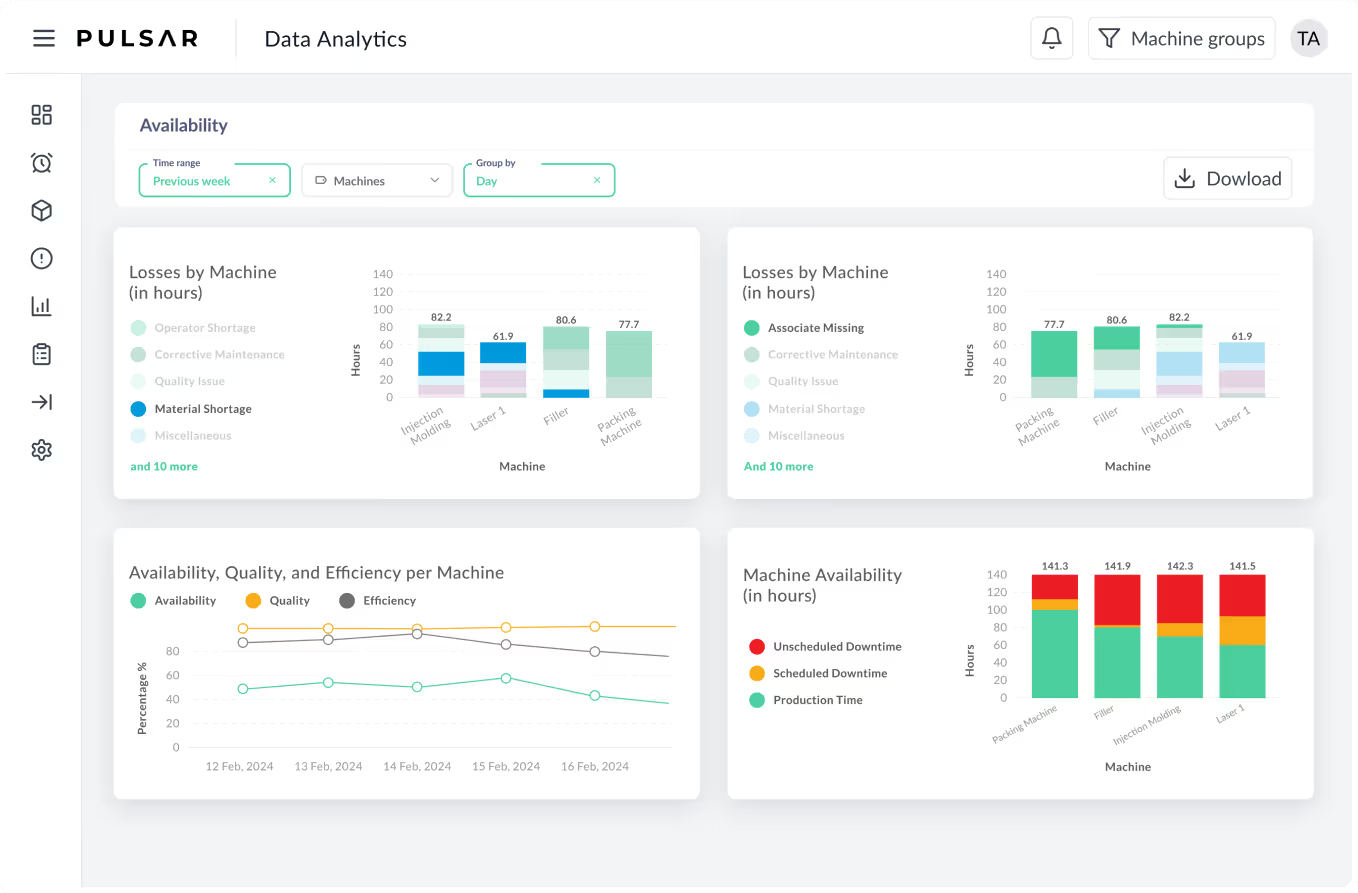
Automated KPIs for manufacturing is just the first step. Pulsar consolidates operational information into reports, indicators, alerts, and production dashboards that help simplify management and support better planning.
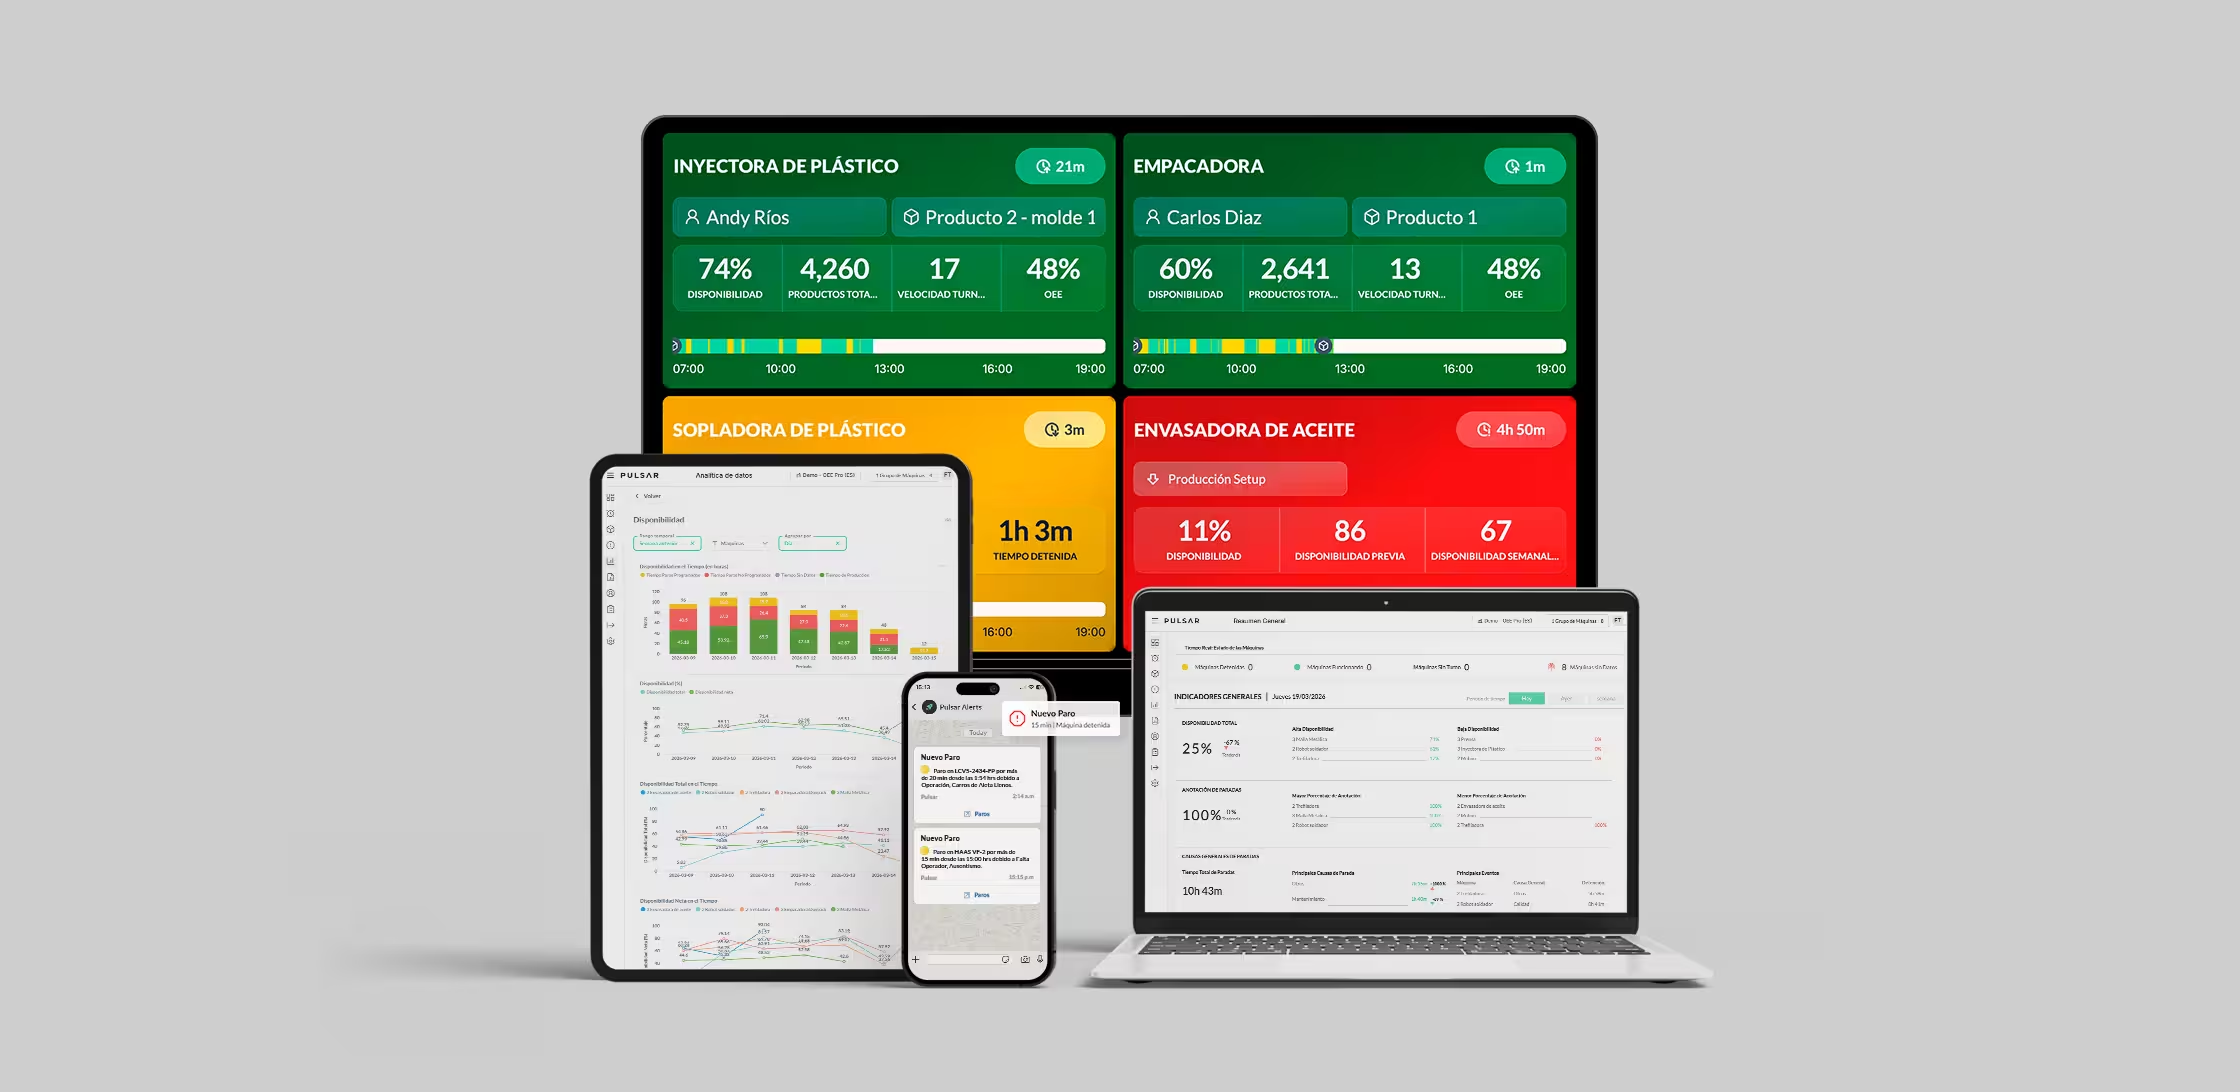
Automated machine tracking of OEE, utilization, downtime, speed, and production.
Customize SMS and email alerts to react to any issues with agility.
Identify patterns and bottlenecks with ready-to-use analytics.
Why Having a Production Dashboard is Critical for the Shop Floor
A production dashboard is a digital tool that consolidates key data from your manufacturing operations into a single, easy-to-read interface. It provides real-time visibility into critical metrics such as machine performance, production output, downtime, utilization, and overall equipment effectiveness (OEE). While Andon and stack lights deliver immediate visual cues about machine status, dashboards provide detailed metrics and performance indicators that help identify the root causes of specific issues. Digital solutions can be:
- Highly customizable: Configure your dashboard to show exactly the metrics your team needs to achieve production goals.
- Designed to monitor a single machine or multiple lines: Focus on one machine or view your entire production line, all from the same dashboard.
- Easy to understand with color-coding: Visual cues instantly flag what needs attention, so anyone on the shop floor can spot an issue at a glance.
- Ready with real-time view with context: Live metrics give your team the full picture as it happens, not just a snapshot after the fact.
Beyond tracking performance, production dashboards help manufacturers identify trends, optimize workflows, and proactively address issues before they escalate into costly downtime. They also enhance communication and coordination on the shop floor, giving operators, supervisors, and support teams a shared view of problems so they can respond quickly and resolve issues efficiently.
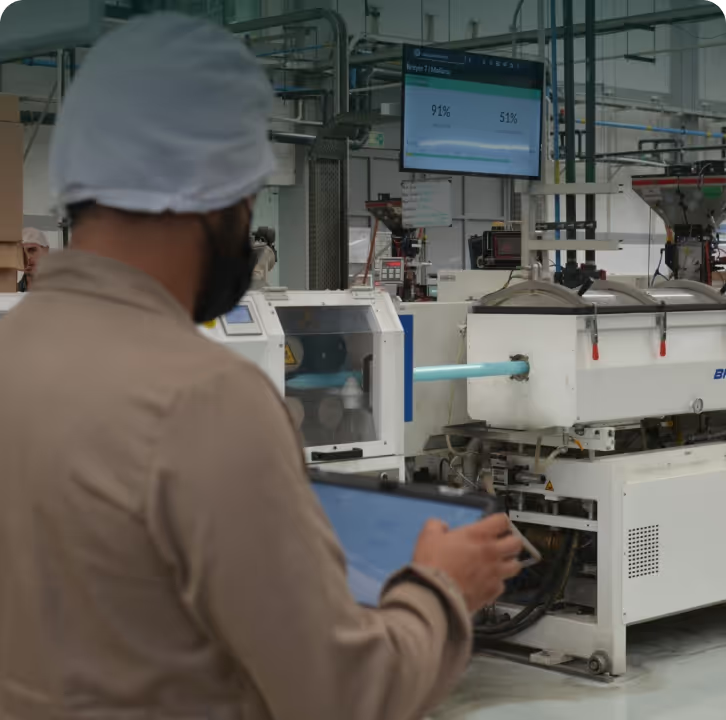
Real-time Production Dashboard
Real-time production dashboards put critical performance data at your fingertips while giving you full control over what you see. With Pulsar, you can customize which metrics to monitor and choose to view a single or multiple machines at once, adapting the dashboard to your specific needs. By combining live insights with visual clarity, these dashboards give manufacturers greater control over operations and a clear view of the shop floor, helping teams identify issues quickly and keep production running smoothly.
Benefits of a Manufacturing Dashboard for Your Shop Floor
Manufacturing dashboards give your team access to real-time indicators, enabling faster reactions, better team coordination, and production planning backed by reliable information.
Keep track of your critical machines from one place
Monitor all essential machinery in a single production dashboard, eliminating the need for multiple systems or manual reports. This unified view helps spot issues and make faster, informed decisions.


Customize to focus on key issues
Highlight the metrics and machines that matter most to your production goals and manufacturing optimization programs. Focusing on critical areas allows your team to identify inefficiencies and address problems quickly.
Improve visibility without changing your setup
Integrates seamlessly with your existing machines and processes, providing real-time insights without disrupting production. Gain clarity on performance and utilization while keeping your current setup intact.

Unlock Efficiency with Dashboards with Automated KPIs
In manufacturing, real-time visibility is critical to keeping operations on track. Live production dashboards collect and display data from machines such as metal stamping presses, injection molding machines, or bottling lines in one centralized interface available directly from the shop floor. Managers can monitor KPIs for manufacturing such as machine utilization, uptime, downtime, cycle time, and throughput instantly, rather than waiting for shift reports or manually compiled logs.
This immediate insight allows teams to react quickly to process deviations, ensuring production targets are met without unnecessary delays. These dashboards also make it easier to focus on the KPIs that drive results for your specific operations. For example, monitoring downtime and production speed in an injection molding process helps identify delays, while tracking machine stops and line speed in metalworking allows teams to optimize scheduling and output.
With KPIs for manufacturing such as OEE, downtime, utilization, and cycles displayed in real time, manufacturers can proactively manage resources, reduce interruptions, and make smarter decisions that keep production running efficiently and consistently.
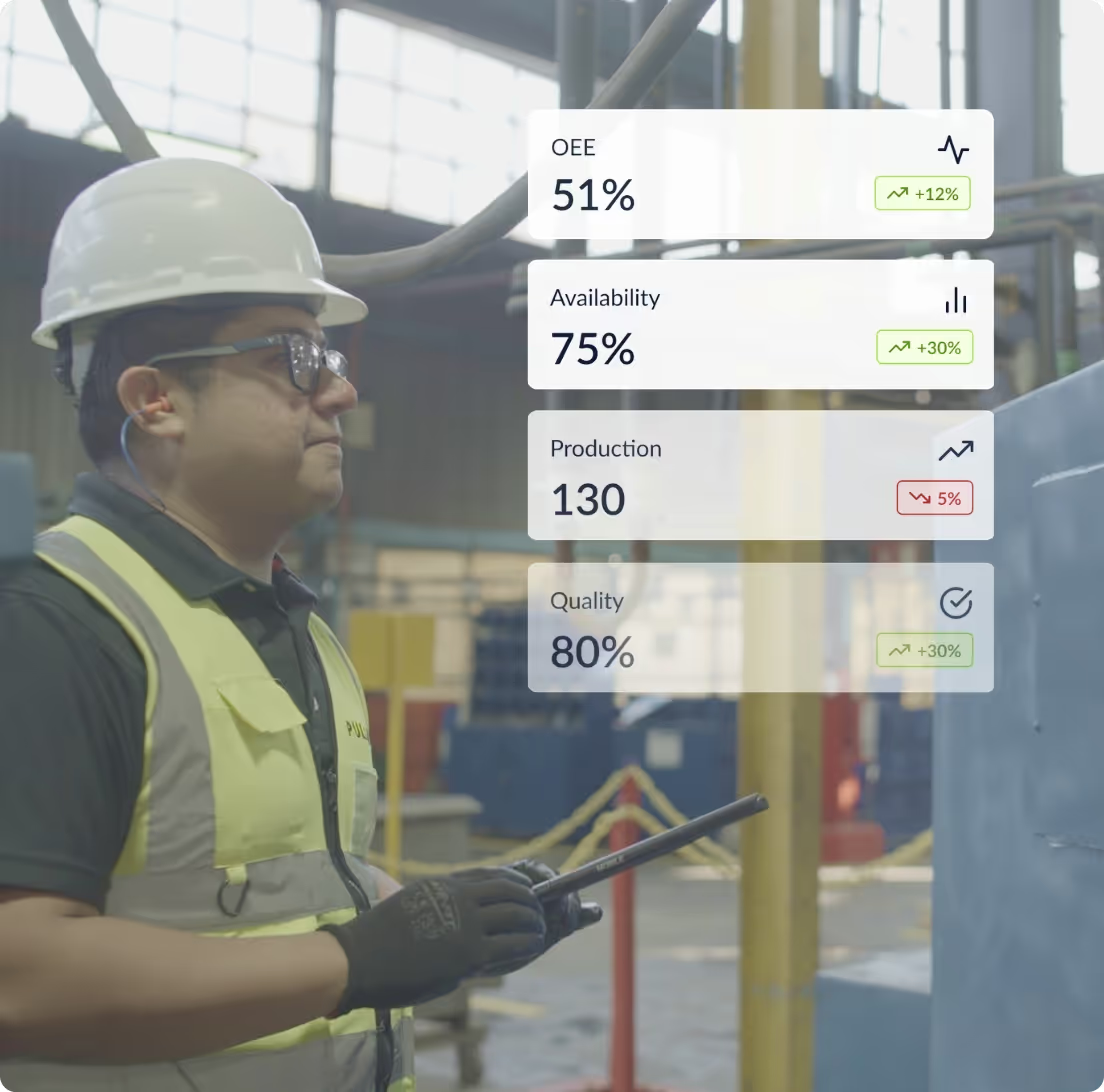
Intuitive dashboard design that drives adoption
By presenting information clearly and visually, our manufacturing dashboard encourages consistent use across operators, supervisors, and managers. With user-friendly layouts, customizable views, and visual alerts powred by machine tracking, Pulsar drives adoption and helps teams act quickly on the insights that matter most.
Clear, live metrics across the shop floor
Visual cues that improve response time
Customizable views for every machine or line
How we benefit our clients
Results achieved by our clients using our automated KPIs for manufacturing.







Drive manufacturing optimization with Pulsar
Implementing software to help with production planning doesn't have to be a long or difficult project. With Pulsar, machine tracking is faster and more effective.

Enable real-time machine tracking, regardless of type, model, or age, without connecting to PLCs.

We collect data automatically and make it accessible to your team from a single, intuitive platform.

Our platform can be installed in a single visit, requires minimal setup, and includes training and permanent technical support.
Frequently Asked Questions
A real-time manufacturing dashboard should first be customizable, since every plant and process has different priorities. A rigid, one-size-fits-all view won't reflect what actually matters to your team. It should also include the KPIs relevant to your specific process and goals, whether that's OEE, availability, downtime, cycle times, or output, rather than a generic set of metrics that don't tie back to what you're trying to improve. Finally, whenever possible, the dashboard should be remotely accessible, so plant managers, supervisors, and leadership can check performance in real time from anywhere, not just from a screen on the shop floor. Together, these elements turn a dashboard from a static display into a practical tool that supports faster decisions and better visibility across the operation. Learn more about how Pulsar's customizable dashboards work, powered by 25+ real-time production metrics and automated machine tracking.
To automate data collection for a production dashboard, you need flexible hardware that can connect to your entire shop floor, not just your newest equipment. Platforms like Pulsar use industrial sensors and data-capture devices that connect to both new and legacy machines, regardless of manufacturer or model, so you're not limited to equipment with built-in connectivity. This is possible thanks to Industry 4.0 technologies, which now enable automated data collection and reporting that used to require manual logs or costly system integrations. On top of that, deployment doesn't have to be disruptive: Pulsar's hardware is minimal and typically installed in a single visit, so you can start feeding real-time data into your dashboard without a long, complex implementation. Learn more about our hardware for automated data collection.
The best approach to manufacturing optimization starts with getting reliable KPIs from your machines using a platform like Pulsar, so you have real visibility into what's actually happening on the shop floor instead of relying on assumptions or manual logs. From there, identify your critical machines and bottlenecks, since not every line or piece of equipment has the same impact on overall output, and focusing on the ones that do gives you the most leverage. Finally, establish a KPI baseline before making changes, then compare results against that baseline as you implement improvements, so you can measure actual impact rather than guessing whether an adjustment worked. For more detail, see our article on the essential steps for process optimization.
Building a manufacturing KPI dashboard starts with going digital. Manual boards or spreadsheets can't give you the precision or speed real monitoring requires, so digital solutions like Pulsar give you real-time dashboards fed by accurate, automatically collected data instead of manual entries that are prone to delays and errors. From there, your dashboard should be customizable, so it reflects the specific KPIs that matter to your process and goals rather than a generic template. Finally, a good digital dashboard needs to be flexible enough to display wherever your team needs it, whether that's a TV on the shop floor, a laptop in a supervisor's office, or a tablet for walking the line, so everyone has access to the same real-time information regardless of device.
Using data analytics for production optimization starts with collecting reliable, real-time data directly from your machines, since analytics are only as good as the data behind them. Once you have accurate data on OEE, availability, performance, and quality, you can identify patterns that aren't visible from manual logs or end-of-shift reports, like recurring downtime causes, underperforming machines, or bottlenecks that consistently affect production. From there, historical analysis lets you compare performance across machines, shifts, or facilities, so you can prioritize improvement actions. Finally, tracking the same metrics after each round of improvement lets you validate whether it actually worked, turning production optimization into a continuous, data-backed cycle instead of a one-time fix. See how our OEE tracking software can give you real-time insights for production optimization.
Standard manufacturing KPIs for OEE improvement start with its three core components: availability (actual run time vs. planned time), performance (actual speed vs. ideal cycle time), and quality (good units vs. total units). Supporting metrics include downtime, cycle times, throughput, and defects, along with reliability indicators like MTBF and MTTR. Tracking these consistently, rather than as one-off projects, is what lets teams spot patterns and measure whether improvements are actually working. Learn how Pulsar automatically monitors 25+ manufacturing key indicators through machine tracking.

Request a custom demo
Discover how our monitoring platform can help you improve your manufacturing KPIs and meet your production goals.