Drive Manufacturing Process Improvement with Pulsar
Manufacturing process improvement starts with having the right data, not just any data. Pulsar's real-time monitoring platform gives shop floor managers and leaders precise, reliable insights into what’s really happening on the shop floor.
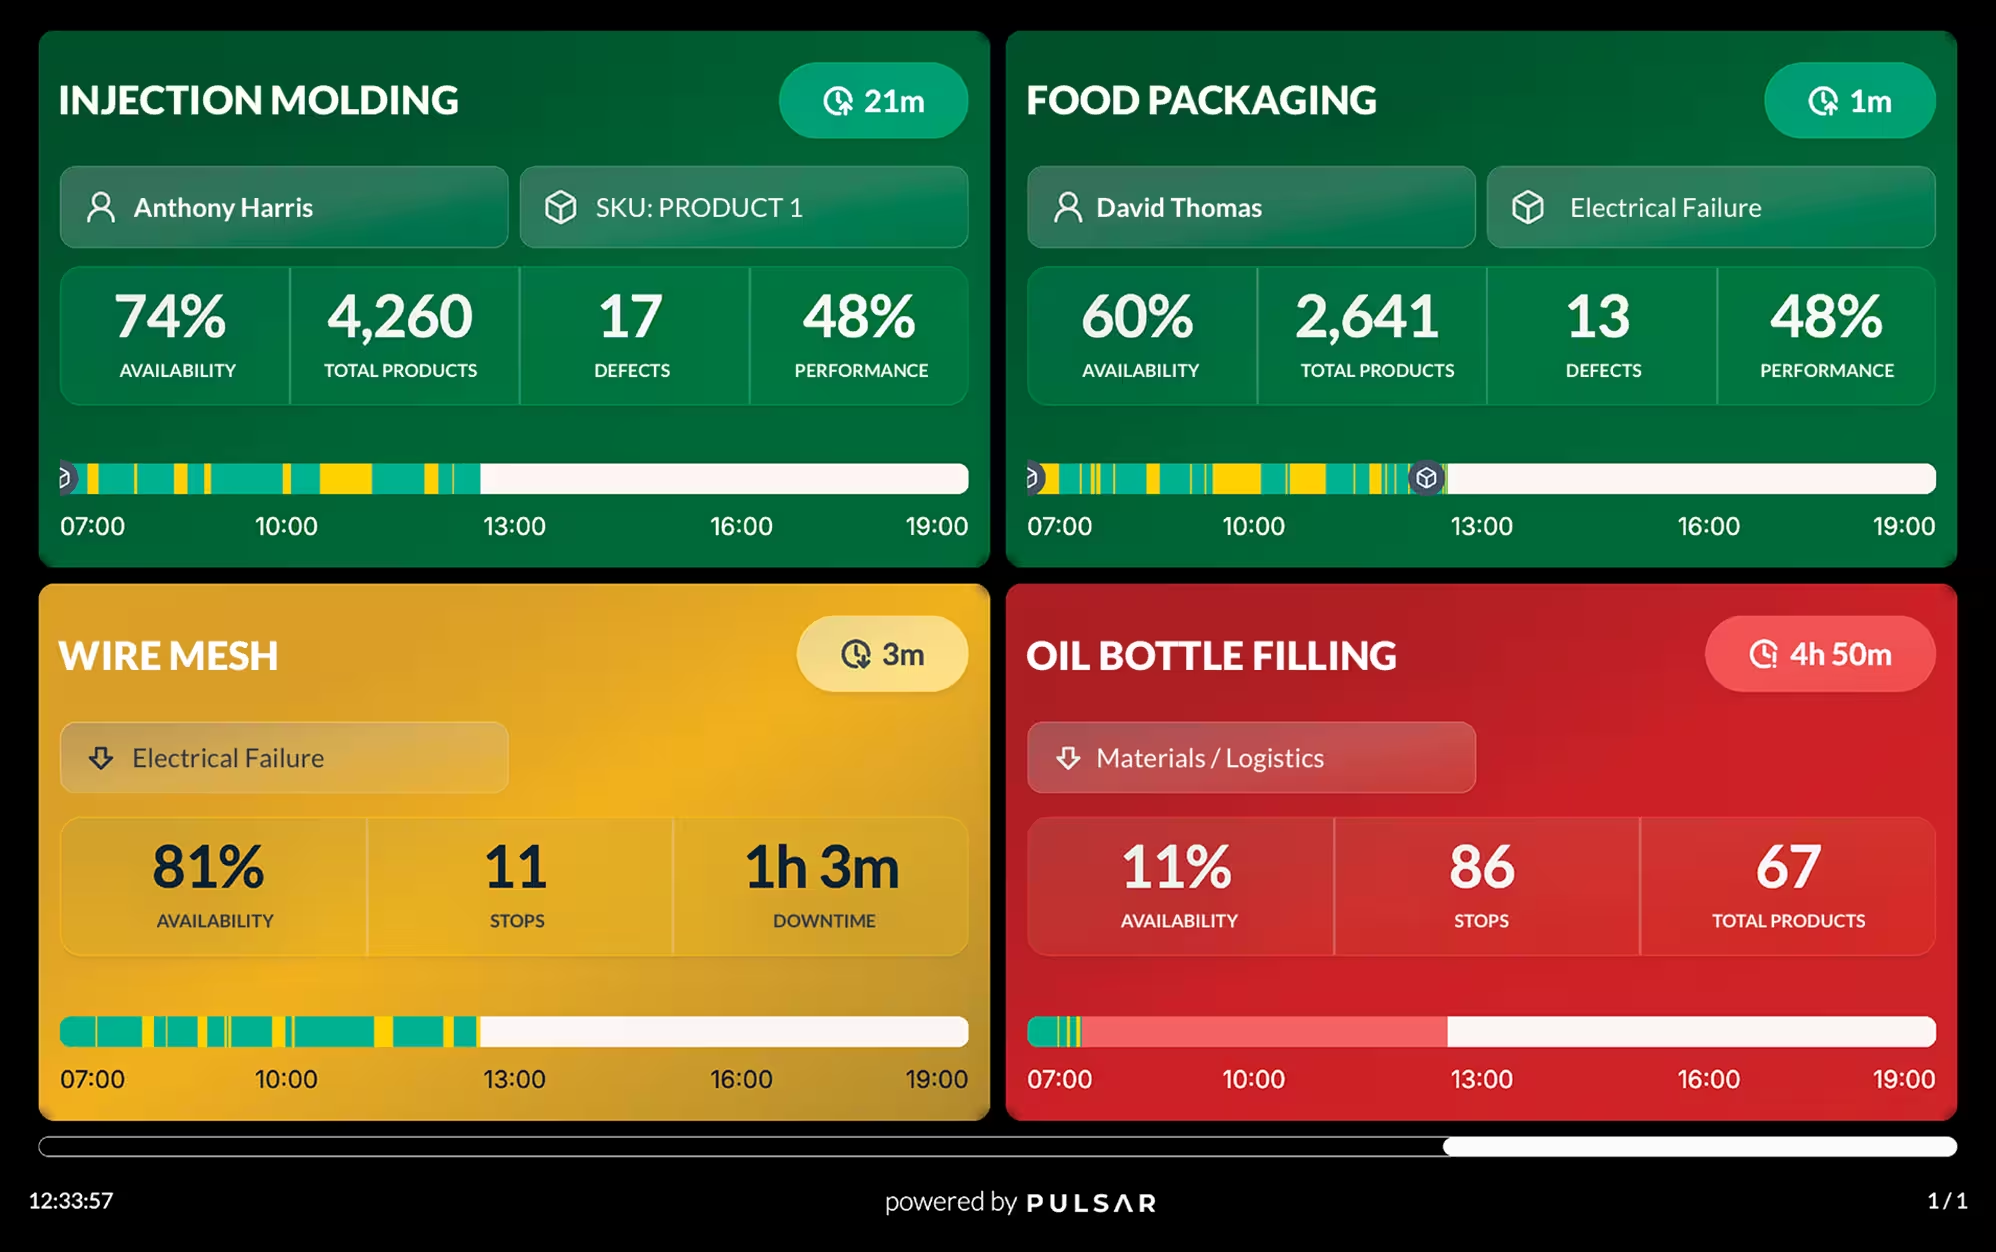

Real-time production visibility from a single platform
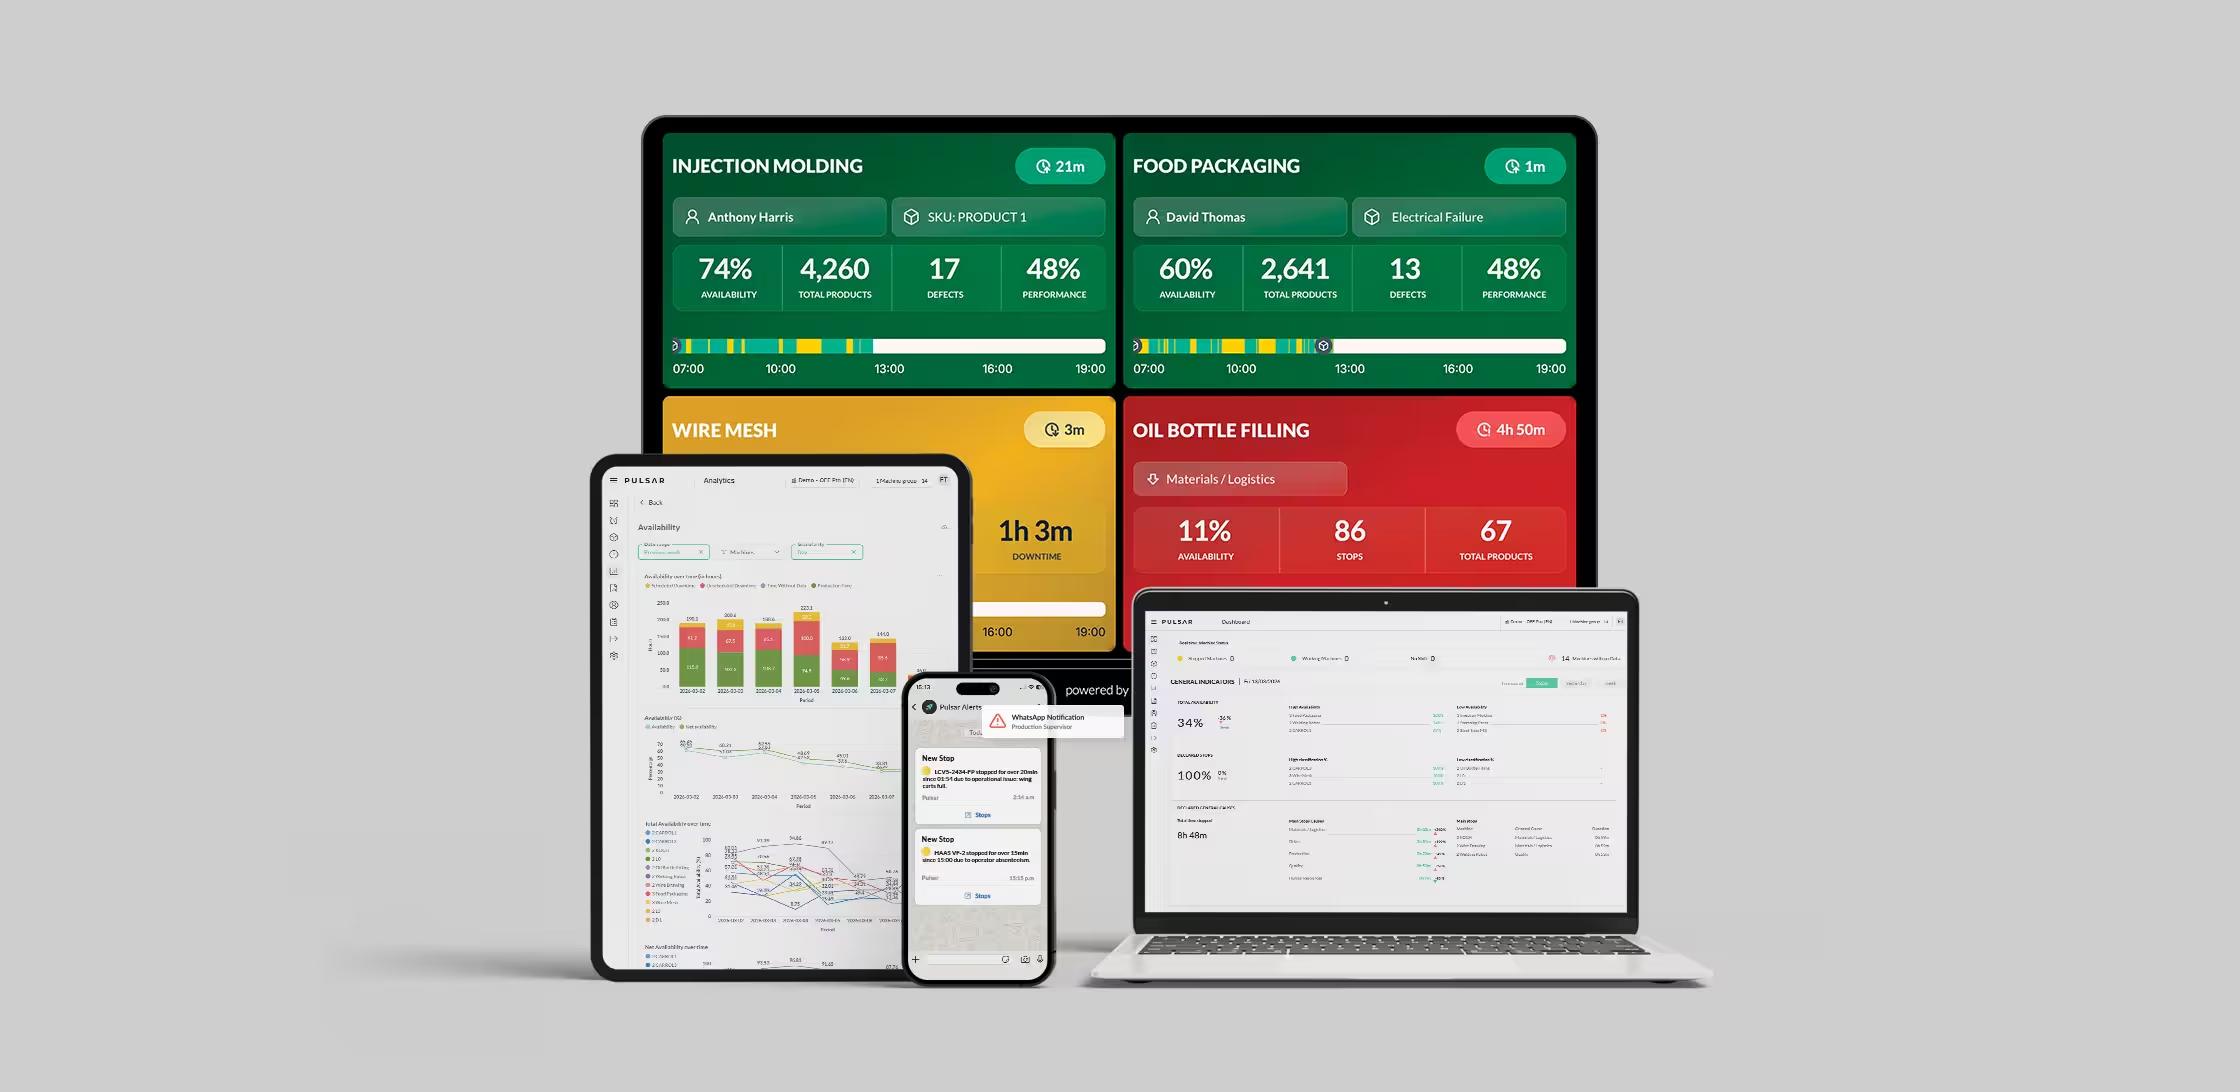
Leverage industrial sensors to gather data from your machines and automate your tracking.
With SMS and email alerts, you can react quickly to any unplanned event
Get insights on your KPIs, define priorities, and improve your processes with precise data
Real-Time Production Visibility: Main Challenges
Digital transformation in manufacturing often fails before it even gets off the ground. Many plants start strong—with ambitious goals and flashy new systems—but stumble when the realities of the shop floor hit. Manufacturing operations are processes that weren’t built for digital tools: there’s legacy machines, limited connectivity, and fragmented processes that can increase the risk of integration projects. In other words, increasing production visibility isn’t just about installing software: it’s about rewiring the way people, machines, and data work together. That’s why it is called a transformation.
A common challenge of manufacturing visibility projects is assuming one solution can fit every machine and every process. In a typical manufacturing environment, you’ll find a mix of old and new equipment, each with its own quirks and communication protocols. Off-the-shelf monitoring systems often rely on PLC data or standard interfaces that many productive machines simply don’t have. The result: limited coverage, unreliable data, or a patchwork of solutions that don’t speak the same language. What many industrial plants require is adaptable, flexible technology—something that can capture meaningful data from any machine, regardless of age or brand—without significant downtime or invasive modifications.
Manual data logging is still the fallback for many plants, but it’s no match for the pace of modern production. Operators logging down run times or downtime reasons can only capture so much, and often after the fact. By the time data is reviewed, opportunities for process improvement are already lost. Human error, incomplete notes, and inconsistent reporting all add up to a distorted picture of performance. Real-time production visibility solves that by automating the flow of data as it happens, giving teams the accuracy, speed, and visibility they need to act, not react.
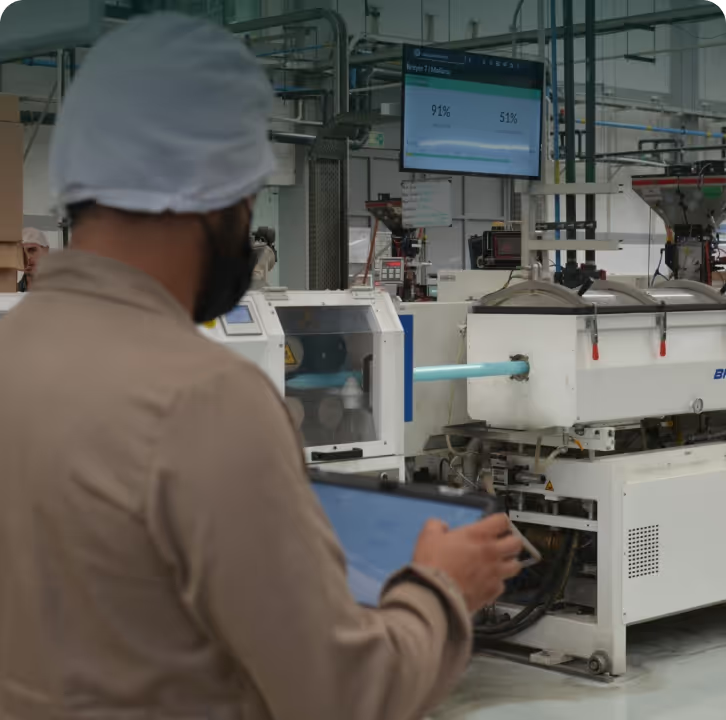
Real-time machine performance
Real-time production performance indicators give you clear visibility into how your machines are running. Instead of waiting for end-of-shift reports, you get live data from Pulsar that pinpoints exactly where you gain or lose performance. Your team can react faster, optimize production shifts, and make informed decisions for process improvement that keep production moving and cut downtime.
Benefits of centralizing your manufacturing performance indicators
You don't need slow reports or meetings to find out what happened last week. With Pulsar, you see your most important metrics in real time, all from one platform.
Manage your production metrics with less effort
Collect production metrics straight from your machines and rely less on manual records. Your team spends less time gathering data and more time analyzing results and defining process optimization actions.


See what needs attention at a glance
Track your manufacturing performance indicators on live analytics dashboards and set up alerts for machine stops or inefficiencies. Your team can react faster to the events that put each shift's production targets at risk.
Get the most out of your current setup and drive process improvement
Monitoring reveals untapped capacity and shows where your machines could run more efficiently. Instead of investing in new machines, you can maximize the value of what you already have. Our automated reports make it clear where to start with process improvement projects.

How does a manufacturing analytics dashboard improve visibility?
A manufacturing analytics dashboard helps production teams see critical information in real time. It brings data from multiple machines and processes into one place, so you can quickly spot performance issues, bottlenecks, and downtime.
Dashboards show key performance indicators like OEE, speed, production, and downtime in a clear format. Plant managers can identify underperforming areas and make improvements before small issues become bigger problems. This proactive approach improves operational efficiency and gets more value from your current setup, without the need to invest in new machines.
When every level of the organization has reliable, real-time performance indicators, the whole team works toward the same goals. People can react quickly to inefficiencies and plan continuous improvement strategies together. The result is less wasted time and fewer lost resources, plus a stronger culture of efficiency and accountability across the factory.
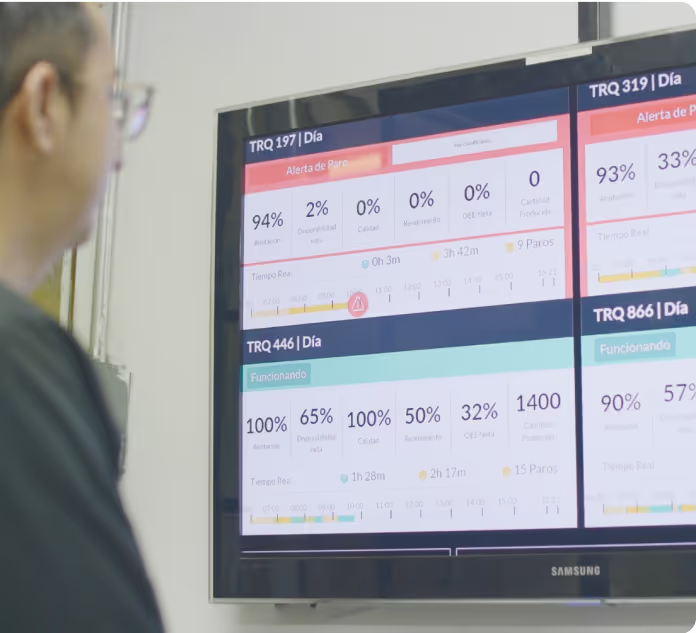


Automated performance indicators
With automated monitoring solutions like Pulsar, manufacturers can focus on improving processes instead of chasing reports. Intuitive manufacturing analytics dashboards make it easy to visualize key performance metrics, identify trends, and address issues as they happen. By seeing what’s really going on in real time, teams can react faster to issues, make informed adjustments on the floor, and continuously refine their operations, spending less time compiling reports and more time driving production performance.
How we benefit our clients
Results our customers achieve with our real-time production visibility platform.







Drive manufacturing process improvement with Pulsar

Enable real-time KPIs for manufacturing process improvement, regardless of type, model, or age, without modifying PLCs.

We collect data automatically and make it accessible to your team from a single, intuitive platform.

Our platform can be installed in a single visit, requires minimal setup, and includes training and permanent technical support.
Frequently Asked Questions
The main manufacturing performance indicators include OEE, availability, performance, quality, actual output versus target, speed, cycle time, and downtime. Tracking the number and frequency of machine stops and defects can also help.
The most relevant metrics vary by process. Every process is different, so you won't always need the same production metrics, and not all of them need to run on real-time monitoring.
A report should include actual output, the planned target, attainment, downtime, availability, and the main causes of loss. Depending on the process, it can also add OEE, speed, quality, and cycle time.
These manufacturing process indicators show the result for the period and explain, at a high level, what drove it. Pulsar generates detailed historical reports that compare machines, shifts, and periods in seconds, thanks to automatic data capture straight from your machines.
First, set a baseline for the production KPI you're working with, such as OEE. Next, look at the events and factors that could be affecting it, like machine stops, speed losses, inconsistent cycles, or defects. From there, you plan possible solutions and corrective actions to improve the process. Once the change is in place, monitor the KPI again to confirm whether it worked.
With Pulsar, teams review current and historical metrics in detailed production reports to support manufacturing process improvement. That helps you spot bottlenecks and inefficiencies, make informed decisions about corrective actions, and check whether those actions deliver a lasting positive impact.
OEE is the main manufacturing performance indicator for efficiency, with its three core components: availability, performance, and quality. Machines and processes should run as much of the scheduled shift as possible, at the expected rate, and turning out good-quality product. A world-class OEE sits at 85%, the result of multiplying the three components together. A company can still be efficient against its own targets even when its overall OEE is lower.
Useful comparisons include those by period, shift, operator, and SKU. To compare without bias, you need accurate data, ideally generated by the machine itself, so results don't skew from observation or memory. When metrics are measured automatically, the data comes in neutral and precise, because the team can't alter it. Pulsar gives you real-time production visibility by standardizing data capture and generating historical reports with filters by machine, shift, and period. That makes comparisons more consistent, though your team still needs to read the results in the context of each process.
Monitoring platforms can collect operating data from your machines, calculate manufacturing metrics in real time, and generate automatic historical reports without manual records. When you evaluate a solution, check which metrics it measures, how it pulls the data, and whether it works with your current setup.
Pulsar automates metrics like OEE, output, availability, performance, quality, speed, cycles, and downtime. The platform also gives you manufacturing analytics dashboards, instant alerts, and historical reports to track performance and drive continuous improvement projects.

Request a custom demo
Discover how our real-time production visibility solution can help you improve your efficiency and productivity.