
Smart Production Reporting: How to Improve Your Plant's Analysis
Production reporting is evolving with more dynamic analysis tools. In this article, you'll learn how AI, automated data capture, computer vision, and manufacturing copilots make it easier to cross-reference, visualize, and query production data, so you can better understand what's happening in your factory.

Content
A manufacturing facility can collect a large amount of data and still take too long to answer a specific question. That's why part of continuous improvement work is setting up production reports so your team can dig deeper and cross-reference variables and data as part of the analysis.
Smart manufacturing technologies are making these reports more dynamic and easier to understand. The goal is no longer just to check key performance metrics for manufacturing. It's to adapt the analysis to the questions and needs of the team working to improve factory efficiency.
Production reporting is shifting from milestones to a daily need
End-of-shift, weekly, and monthly production reports are good practices. They help keep the operation efficient and consistent. Today, though, it matters more to have up-to-date information and to run more complex analyses without spending so much time building a report.
If a line's availability drops, for example, the person in charge may need to know whether the change is concentrated in one machine, one shift, or a specific SKU. A KPI report can show the anomaly, but it doesn't always make it easy to investigate.
A more dynamic production analysis lets you cross-reference information such as:
- OEE comparison between two machines over time
- Hours of planned downtime in a month, broken down by operator
- Lost capacity hours by SKU over three months
Once you have accurate data, AI can help you run more complex or in-depth analyses and build interactive charts that are easier to understand.

How does AI analytics drive production analysis?
In manufacturing, artificial intelligence can make it easier to explore the data you collect, especially when you have many machines, products, periods, and KPIs to compare.
Among other benefits, AI reduces part of the work in production reporting needed to organize and query information.
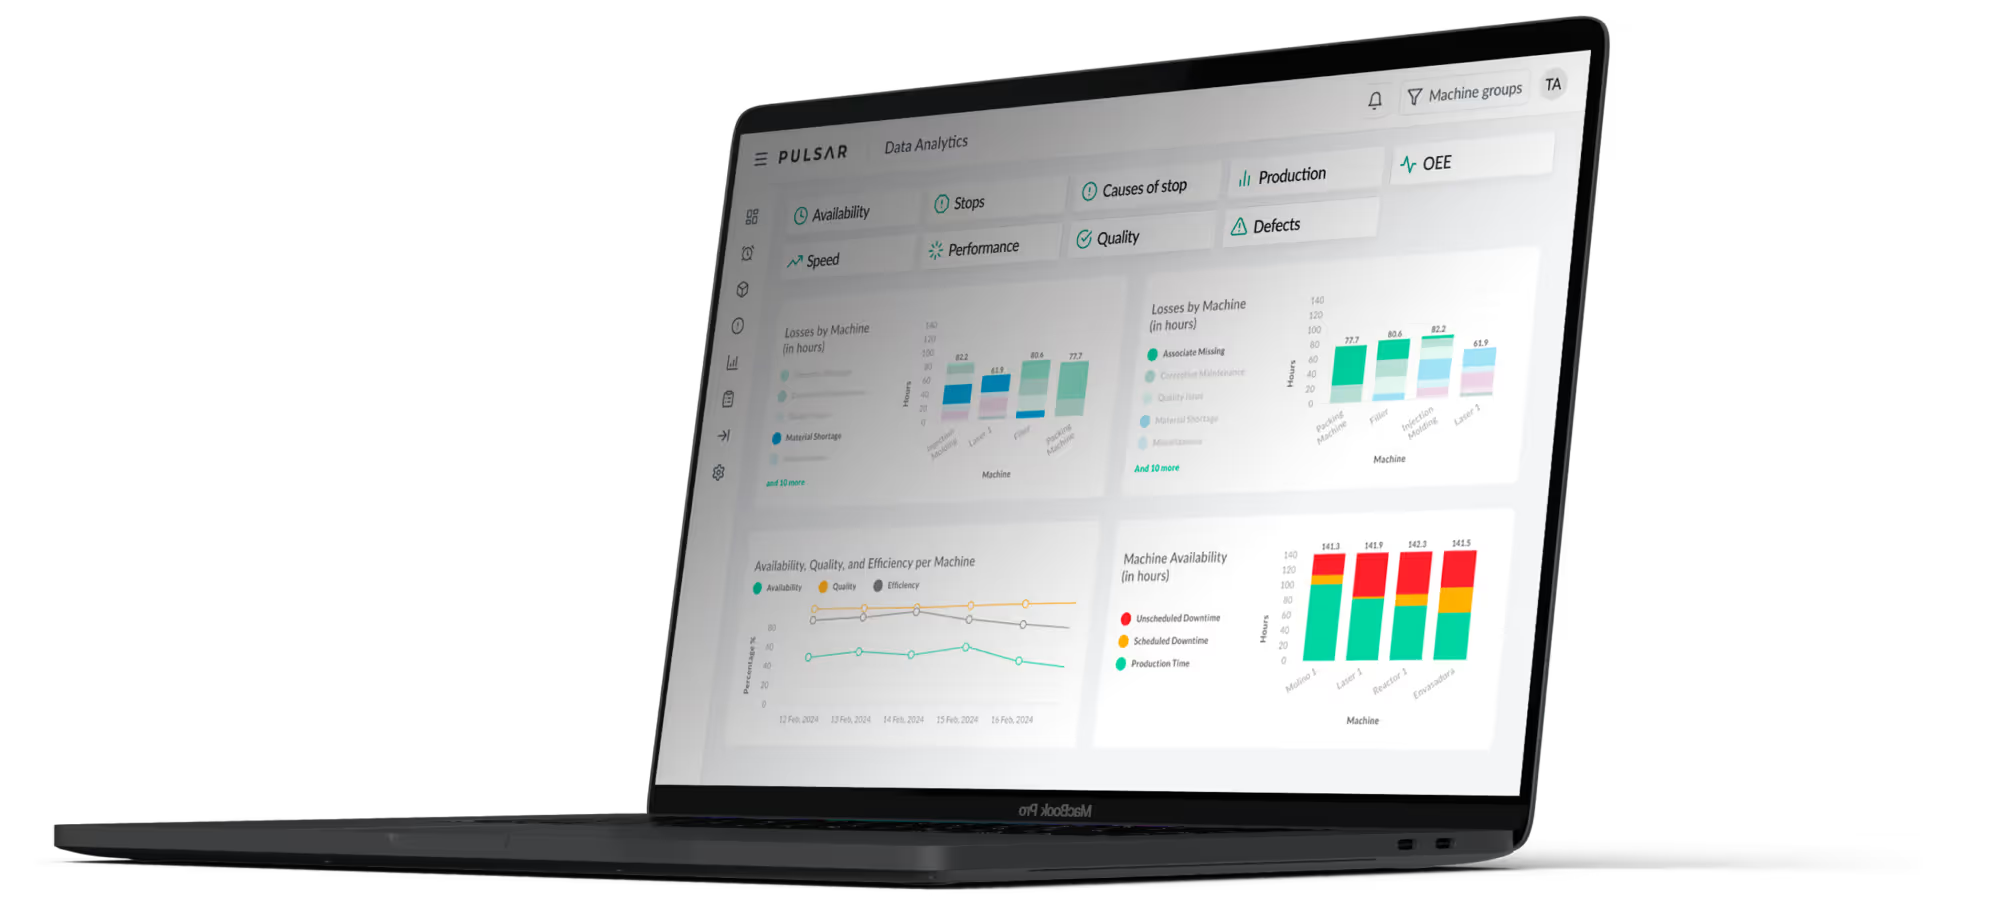
Charts, tables, and metrics for each analysis
Analyzing recurring machine stops, comparing speed across SKUs, and reviewing performance against targets each call for different metrics and visuals.
AI analytics can make it easier to create these views from the data available in interactive reports.
Reports with up-to-the-minute information
Custom dashboards let you organize the same data based on the process, the person in charge, or the problem you're analyzing.
They also offer dynamic filters, so you can investigate the operation by machine, SKU, shift, or period and pinpoint where a deviation happens.
Automated production data monitoring improves the information available for analysis
A better production report also depends on better information flowing into it.
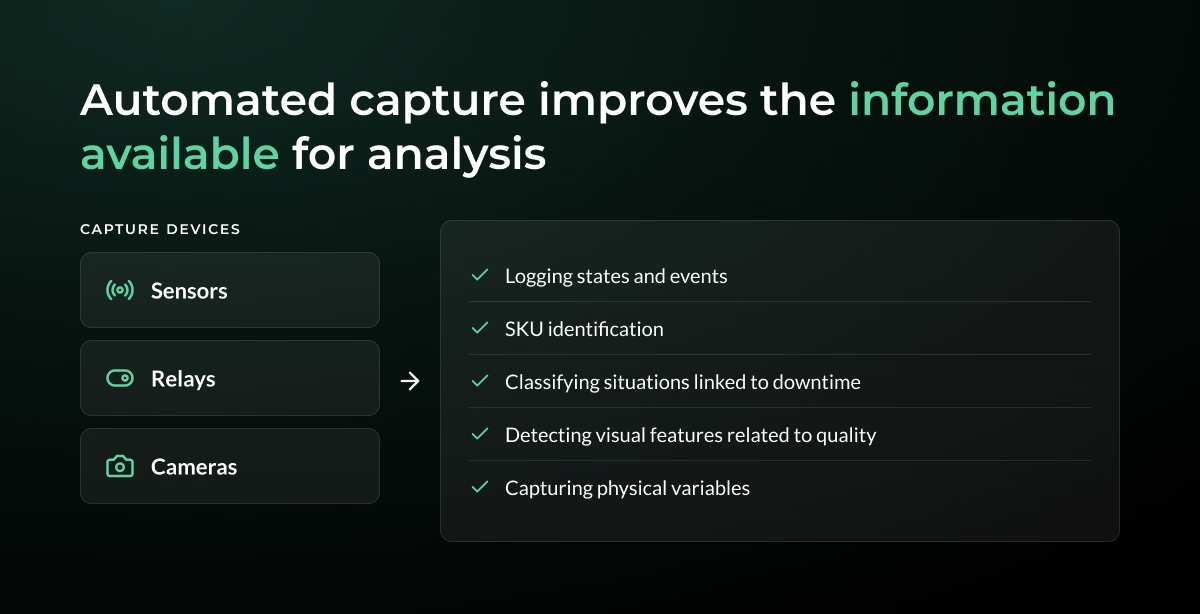
Sensors, relays, cameras, and other capture devices can automate how you collect operational variables. They also add more context about what's happening on the shop floor.
Depending on the application, these technologies for production data monitoring can help record statuses and events, identify SKUs, classify certain situations related to machine stops, detect visual features related to quality, or capture physical variables.
Smart cameras are especially useful for traceability and defect detection. They don't just enrich your reports. They also help supervisors follow up on events and issues on the shop floor.
The next step: Production data monitoring
Manufacturing copilots bring another evolution: querying production data in natural language.
Instead of setting up each filter manually, you could ask questions like "How did this line's availability change over the last four weeks?" or "Compare this SKU's speed across shifts."
This kind of technology makes it easier to query large volumes of production data, which supports the analysis of plant managers, engineers, and continuous improvement teams. Bringing natural language into reports speeds up the process. It also helps production and continuous improvement teams focus on getting results and solving problems instead of cleaning up data.
From production reporting to smarter manufacturing
Analyzing KPIs and using reports in continuous improvement processes is a key step for highly competitive manufacturing companies. Still, a lot of manual work goes into collecting, cross-referencing, visualizing, and querying information. This is where new technologies add real value to daily operations.
The evolution looks like this:
Accurate production data → Accurate, dynamic analysis → New sources of context via production data monitoring → Fast, direct queries
These capabilities are part of the evolution of Industry 4.0, but their value is operational. They give teams easier access to the information they need to analyze problems, verify results, and follow up on improvements.
How Pulsar brings AI and machine learning to production analysis
Pulsar uses machine learning and AI analytics to help plant leaders explore and connect the production data their operation generates.
These capabilities make it easier to cross-reference data and create visualizations, dashboards, and reports tailored to different analysis needs.
The platform also uses its own data capture hardware, including sensors, relays, and smart cameras, to automate production data monitoring and get up-to-date information from your machines and processes.
The goal is to give your team deeper operational insight with less effort, so they can work more efficiently.
See how Pulsar can help you analyze your production data with more intelligence and speed. Book a demo.

Frequently asked questions
What should a modern production report include?
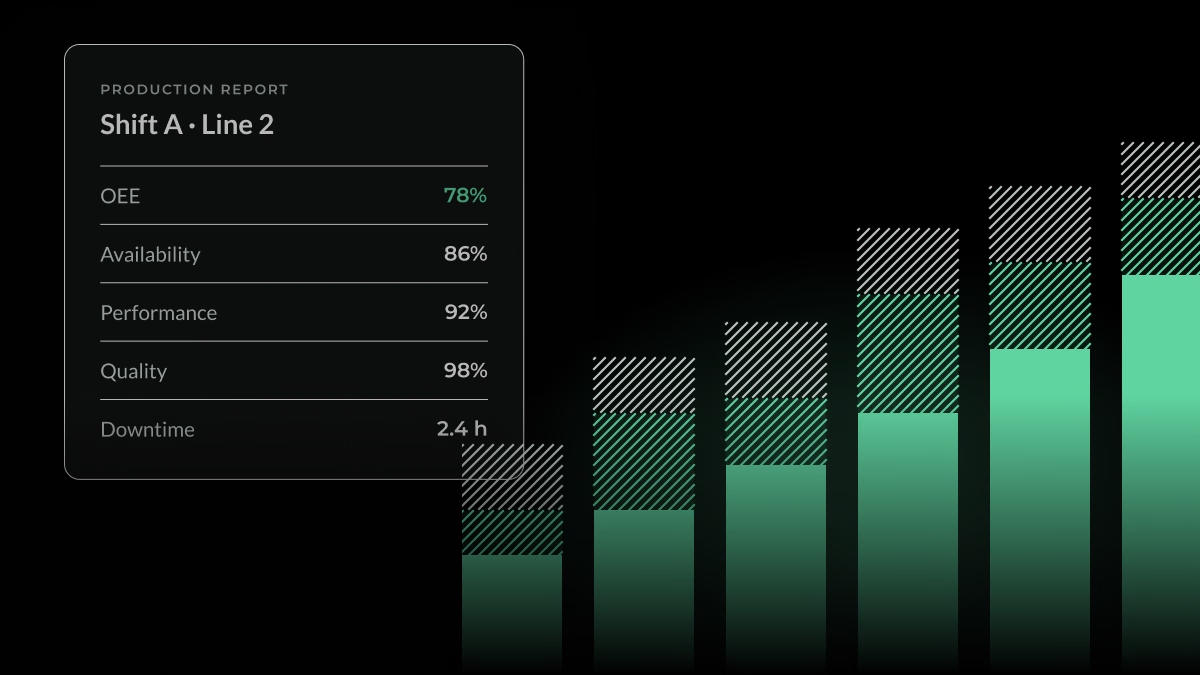
It depends on whether it's a report on what was produced or a historical report. It can include production, target attainment, OEE, availability, performance, quality, speed, cycles, and machine stops, plus filters by machine, line, shift, SKU, operator, or period.
How can AI improve production reporting?
AI makes it easier to organize, visualize, and explore production data, so you can adapt the analysis to different operational questions. It also helps you generate reports faster and run more complex analyses in less time.
How do production reports relate to smart manufacturing?
Smart manufacturing automates part of how you capture, organize, and query information, so you can run more detailed analyses. With AI, you can also detect patterns, analyze large amounts of production data quickly, and cross-reference different types of reports, among other things.
Related articles
Request a Custom Demo
See how Pulsar’s manufacturing intelligence platform can help your operations today.