
Manufacturing productivity: smart technology, same machines
Improving manufacturing productivity doesn't always require new machinery. Real-time visibility, digitized processes, and historical analysis show where efficiency, production, and communication fall short. With Industry 4.0 technology, a company can improve its processes using the machines it already has and move toward a smart factory.

Content
Reaching the end of a shift with production targets missed, even with the lines running, is common in many plants. But the gap between what you can produce and what you actually deliver is almost never closed by buying new machinery.
Manufacturing productivity recovers better through how well you use the machines you have, how fast you catch inefficiencies, and how well production, planning, and continuous improvement work together. Machine stops, slow cycles, defects, waiting, and stale data all hold back output, even when your machines can produce more.
Manufacturing technologies such as Industry 4.0 enable visibility into your machines and their performance without replacing your production setup. Through sensors, industrial connectivity, monitoring platforms, cloud services, and artificial intelligence, a factory can better understand its operation, digitize its processes, and react faster to hit its production goals.
Below, we explain which parts of the operation you can modernize, which smart technologies help you do it, and how to bring them in gradually without replacing your machines.
The key to increasing manufacturing productivity? Operational visibility
Before you change a machine or adjust a process, you need to understand where time, capacity, or quality is lost during production. To do that, a plant can monitor how its machines perform and tie that to production goals, cycle times, machine states, and quality data.
This information lets you compare expected performance with real behavior and find opportunities to improve OEE, availability, speed, quality, and flow between processes.
Real-time visibility into production
End-of-shift reports help you review what happened, but they don't show the line or machine's current state.
With real-time data, plant managers, process engineers, and the production team can check things like:
- Machines running or stopped
- Progress against the shift target
- Production counts
- Speed and cycle times
- Availability and performance
- Defects or rejected parts, when that data is available
- The length and frequency of machine stops
This shared reference cuts the reliance on floor walks, phone calls, and reports pulled together at different times. It also makes it easier for the teams involved to work from current information about the state of production.
Industry 4.0 and digital manufacturing technology like industrial sensors, edge devices, and the Industrial Internet of Things (IIoT) supports real-time visibility by pulling signals from machines of different generations and models. The data can go to a local or cloud platform, where it's centralized and presented for review and tracking.
Finding losses and bottlenecks
Industrial productivity takes a hit from planned and unplanned machine stops, micro-stops, cycles slower than expected, missing materials, rejects, rework, or waiting between processes.
Some losses are obvious. Others add up over the shift without being recorded in enough detail. A short interruption can look minor on its own, but repeat it, and it slows a machine's progress or pushes delays onto the next operations.
Looking at production, speed, quality, machine states, and waiting between processes together helps you find where the bottleneck sits and how it affects the flow of work.
For scenarios like these, advanced analytics and Artificial Intelligence solutions can process historical data to catch recurring issues, unusual behavior, and the performance of shifts, machines, or processes that would be hard to spot through observation alone.
For example, AI is useful not only for identifying bottlenecks, but also for flagging when a process runs outside its normal accuracy and speed. It can even build estimates or visualizations to anticipate the result of specific decisions or conditions.
Precise metrics and process optimization
Spotting an inefficiency doesn't automatically improve the process. The data gives you evidence to guide decisions, but it's the teams who investigate the causes, decide on actions, and check the results.
A Kaizen project led by the production and process engineering teams can use operating data to:
- Frame the problem by reviewing the last few months of behavior
- Set a performance baseline for a process or machine
- Prioritize losses by their impact, frequency, or how often they recur
- Form and test hypotheses about the possible causes
- Assign actions, owners, and timelines
- Compare performance before and after each change
- Track results and catch any backsliding
- Check whether there's recoverable capacity before investing in new machines
This way, process optimization stops depending on one-off actions and becomes structured continuous improvement work. Historical data and comparisons also let you confirm whether an action produced a lasting change or the problem came back.
One strong use of Industry 4.0 technology is the digital twin, which can support certain Kaizen projects with a virtual representation of a machine, a line, or a process. With the right data and models, digital twins let you test scenarios (such as sequence changes, line balancing, or operating times) before you make a physical change on the floor.
Automatic data collection also makes it easier to investigate and identify problems and to measure the impact of Kaizen projects.
Smart factories run on data, not spreadsheets
Manufacturing productivity can also be held back by tracking processes that require collecting, transcribing, and consolidating information manually. Spreadsheets are useful for certain analysis, but they fall short and take too long to build when they become the main source for knowing the state of production, logging machine stops, or coordinating responses.
A smart factory automates these activities instead of running them by hand. Manufacturing technologies support your processes in many different ways. Planning and execution systems help organize production. Monitoring platforms pull data from the machines. Downtime logging software replaces paper logs. And connected workforce solutions make it easier for teams to capture, review, and share information from the shop floor.
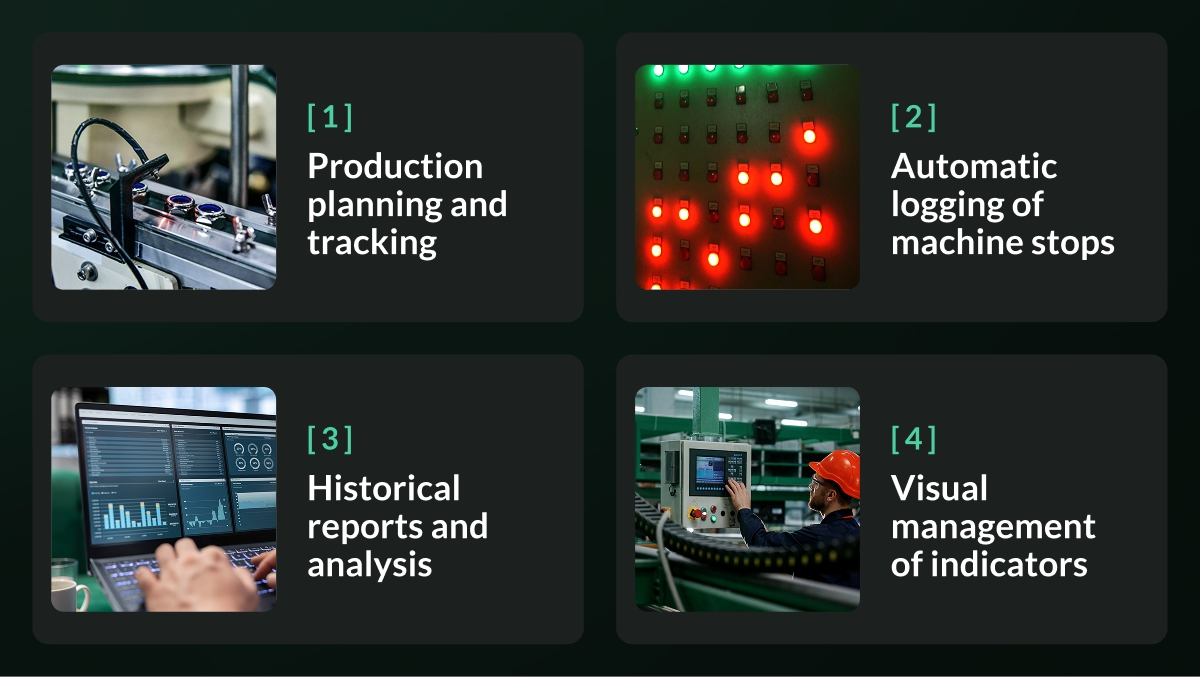
Production planning and tracking
A production plan is harder to hit when you can only check progress at the end of the shift, or when it means gathering information from different people.
Digitizing this lets you compare, more quickly:
- Planned production against real production
- Targets by shift, line, or product
- Cumulative progress
- Deviations from the plan
- Available time and capacity used
This information helps you recognize when the line's real behavior no longer matches the plan. It also flags unexpected events, like a long machine stop, a drop in speed, or falling behind the target.
MES systems and other production tracking solutions can connect the schedule to how it actually runs. Industrial monitoring platforms let you check real progress and trigger alerts when a relevant event happens, or an indicator moves outside the expected range. That way, the people responsible can see what went wrong without waiting for the end of the shift, and react faster to hit their targets.
Automatic capture and logging of machine stops
In many plants, the causes and durations of machine stops are still written down in paper logs. Those records can end up incomplete, rely on estimates rather than precise data, or use different criteria across operators and shifts.
The difficulty grows when several people need that information. Reading a paper log, transcribing it into a spreadsheet, and passing around updated versions eats up time, limits traceability, and can leave production, maintenance, and continuous improvement teams working from data that doesn't always line up.
Combining automatic capture with digital logging lets you bring together:
- States, times, and durations pulled straight from the machines
- Causes or comments logged by the users
- Targets, shifts, and products that are set up
- Context tied to each machine, order, or process
Downtime logging software and monitoring platforms can automatically record when a machine stops and how long it's down. When the cause can't be pulled straight from the machine, connected workforce solutions, digital forms, and some software let staff add context from a terminal, tablet, or other device. This combines objective machine data with the knowledge of the people who worked the shift.
Historical reports and analysis
When reports and logs are built by hand or in spreadsheets, a big share of the time goes to gathering files, checking versions, and fixing differences before the analysis even starts. On top of that, the information can end up scattered across teams, shifts, and owners.
Automatic reports and centralized historical data let you:
- Compare machines, lines, shifts, and products
- Analyze trends in production, speed, and availability
- Spot recurring machine stops or deviations
- Review how an indicator moved over a period
- Set a baseline before rolling out an improvement
- Compare performance before and after an action
Industrial monitoring platforms can organize the captured data and generate reports with consistent criteria. Cloud solutions make it easy for different people to review, while business intelligence tools can cross-reference production data with other sources. With enough data quality and volume, advanced analytics can also surface patterns that need a closer look.
Visual management of indicators
Indicators lose their value when they're spread across files, whiteboards, and reports that update on different schedules. That fragmentation makes it hard to recognize priorities and communicate performance changes.
Dashboards and screens installed on the shop floor can show the information that matters for each level of the operation. An operator may need to know the progress and state of their machine. A supervisor may need to stay on top of machine stops or compare machines or lines. A manager may need to review trends and how targets are being met.
Monitoring platforms and digital Andon boards can show states, targets, alerts, and indicators in a visual, up-to-date format. Connected workforce solutions can also route this information to specific users and support escalating issues among the people responsible.
The point of visual management isn't just to display data. It's to help the production team recognize and communicate inefficiencies, priorities, and relevant events faster, making smarter decisions and gaining agility to solve problems.
Productivity also comes from connecting your systems
A plant can collect large amounts of data and still run into coordination problems when each area works from different systems, files, or criteria.
This is where integration matters. A smart factory connects its systems so they work together, not in isolation. Industry 4.0 technology lets you connect ERP, MES, and monitoring platforms so they exchange data automatically, so every area works from the same numbers.
You don't need to bring every single process into one platform. The real work is deciding what information to exchange, where it comes from, and how often it should update. Keep the focus on your operation and on giving your team what it needs to work more productively.
Integration between ERP, monitoring, and MES systems
Each system does a different job. The ERP can hold orders, products, and production targets. The MES manages execution and traceability. A monitoring platform captures data on how the machines behave.
Through an API integration, these systems can exchange specific fields automatically. For example, the ERP or MES can send the monitoring platform the active order, product, target, and shift. The platform can then tie that context to counts, cycles, states, machine stops, and indicators pulled from the machines.
This connection lets you compare what was planned against what actually ran, without preparing each report by hand. It also helps you analyze a machine stop, a loss of speed, or a delay in the context of the order in production.
APIs are an important part of this approach because they connect specialized manufacturing technologies, streamline data flow, and improve visibility across operations.
Connecting with Power BI and Tableau
Power BI and Tableau let you take operating data to a deeper level of analysis. A monitoring platform can supply information on production, availability, speed, cycles, and machine stops through APIs, connectors, databases, or scheduled exports.
From that information, the people responsible can build visualizations to:
- Compare plants, lines, machines, shifts, or products
- Analyze trends in OEE, availability, and performance
- Drill from a high-level indicator down to the events that explain its variation
- Build Pareto analysis on losses or logged causes
- Contrast periods before and after an improvement
- Spot recurring issues and differences between similar machines
Power BI and Tableau don't replace capturing data straight from the machines. Their job is to visualize, connect, and analyze the information that operating platforms and other systems provide.
Reduce data fragmentation
Reducing data silos doesn't mean concentrating the whole operation in one tool. It means setting a single source of truth, so teams work from current data and use the same criteria when reading specific metrics.
In this setup, the ERP can stay the reference for orders, the MES for execution, and the monitoring platform for machine events and indicators. An API integration connects these sources and keeps each area from holding different versions in spreadsheets, emails, or isolated reports.
This way, the different teams can work from consistent operating data. That cuts the time spent hunting for versions, reconciling differences, and rebuilding information before the analysis begins.
Powering analytics and reports with manufacturing technology
Improving processes means comparing results, spotting patterns, and checking whether a change produced the expected outcome. With a monitoring platform that has advanced analytics, or a business analytics solution, operating data can be organized into reports and historical records that update automatically.
This reduces the time spent gathering and consolidating information and lets you track improvement efforts with consistent criteria.
Indicators that update automatically
Preparing indicators by hand takes time and creates differences between reports from transcription errors, different formulas, or inconsistent cut-off periods. Operators in industrial plants often spend hours pulling machine data by hand or transcribing paper logs.
Many digital tools update indicators and data automatically. For example, a monitoring platform can calculate and update production, availability, performance, and other metrics using automated data capture hardware. Precise metrics can also come in from other systems or digital records. Once it's collected and consolidated in one system or platform, exporting and analyzing it with specialized tools is much easier.
Historical analysis and trends
Collecting and updating data is one part of the work. The other part is analyzing it. Quick historical reports with current information are a strong tool for production and continuous improvement teams that want to manage production better.
Instead of spending hours building these reports, modern technology helps you generate them in seconds and even share the data across systems.
A historical analysis can show, for example:
- Changes in capacity, speed, production, or cycles
- Differences in production across shifts, SKUs, or seasons
- The impact after a Kaizen project or productivity bonuses
Business analytics platforms and advanced analytics tools let you filter, compare, and visualize this data to find patterns that matter. Historical data doesn't pin down a cause on its own, but it reduces uncertainty and points the investigation toward the hypotheses you need to test on the floor.
Tracking improvement actions
An action shouldn't count as a success just because it was carried out. You need to check whether it changed the process it was meant to fix, and whether that result held over time.
Automatic reports let you compare the condition before and after your process optimizations, measure the impact of the change, and spot new opportunities. Their accuracy comes from being generated with the same criteria, analysis periods, and data sources, without relying on someone to gather, transcribe, or consolidate the information each time.
They can also be scheduled to generate at a set time (by email, for example) or to update when new data comes in. That way, the people responsible get timely information on how an indicator is moving without waiting for someone to prepare the report by hand.
This tracking makes it easier to evaluate improvement actions with comparable evidence and to catch a process drifting back to its earlier behavior faster.
Explore our platform
How do you choose the right technologies to drive manufacturing productivity?
Improving manufacturing productivity takes more than adding technology. You have to make it part of how your team already works and use it to sharpen your daily processes, always with the goal in mind. Smart factories combine manufacturing technology and processes to make better decisions and react faster when something goes wrong.
Platforms like Pulsar support you through your company's transformation by bringing Industry 4.0 technology together in a monitoring and analysis platform, backed by training and ongoing technical support. Sensors, relays, smart cameras, and other capture devices pull signals from the machines. Industrial connectivity transmits them. The Cloud centralizes the information so you can review it from different devices in real time.
The combination of industrial hardware and software makes Pulsar a complete platform for capturing data from machines of different brands and generations, centralizing it, and turning it into reports and alerts, without necessarily depending on PLCs. All through an interface that's easy to use and easy to adopt in daily work.
Real-time monitoring
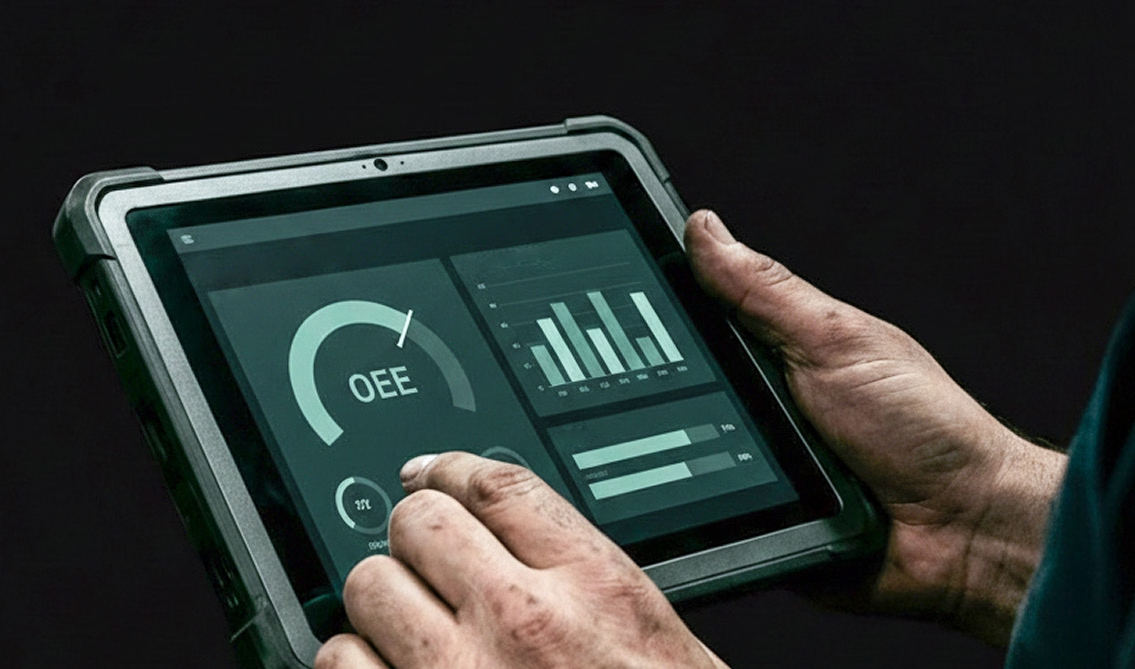
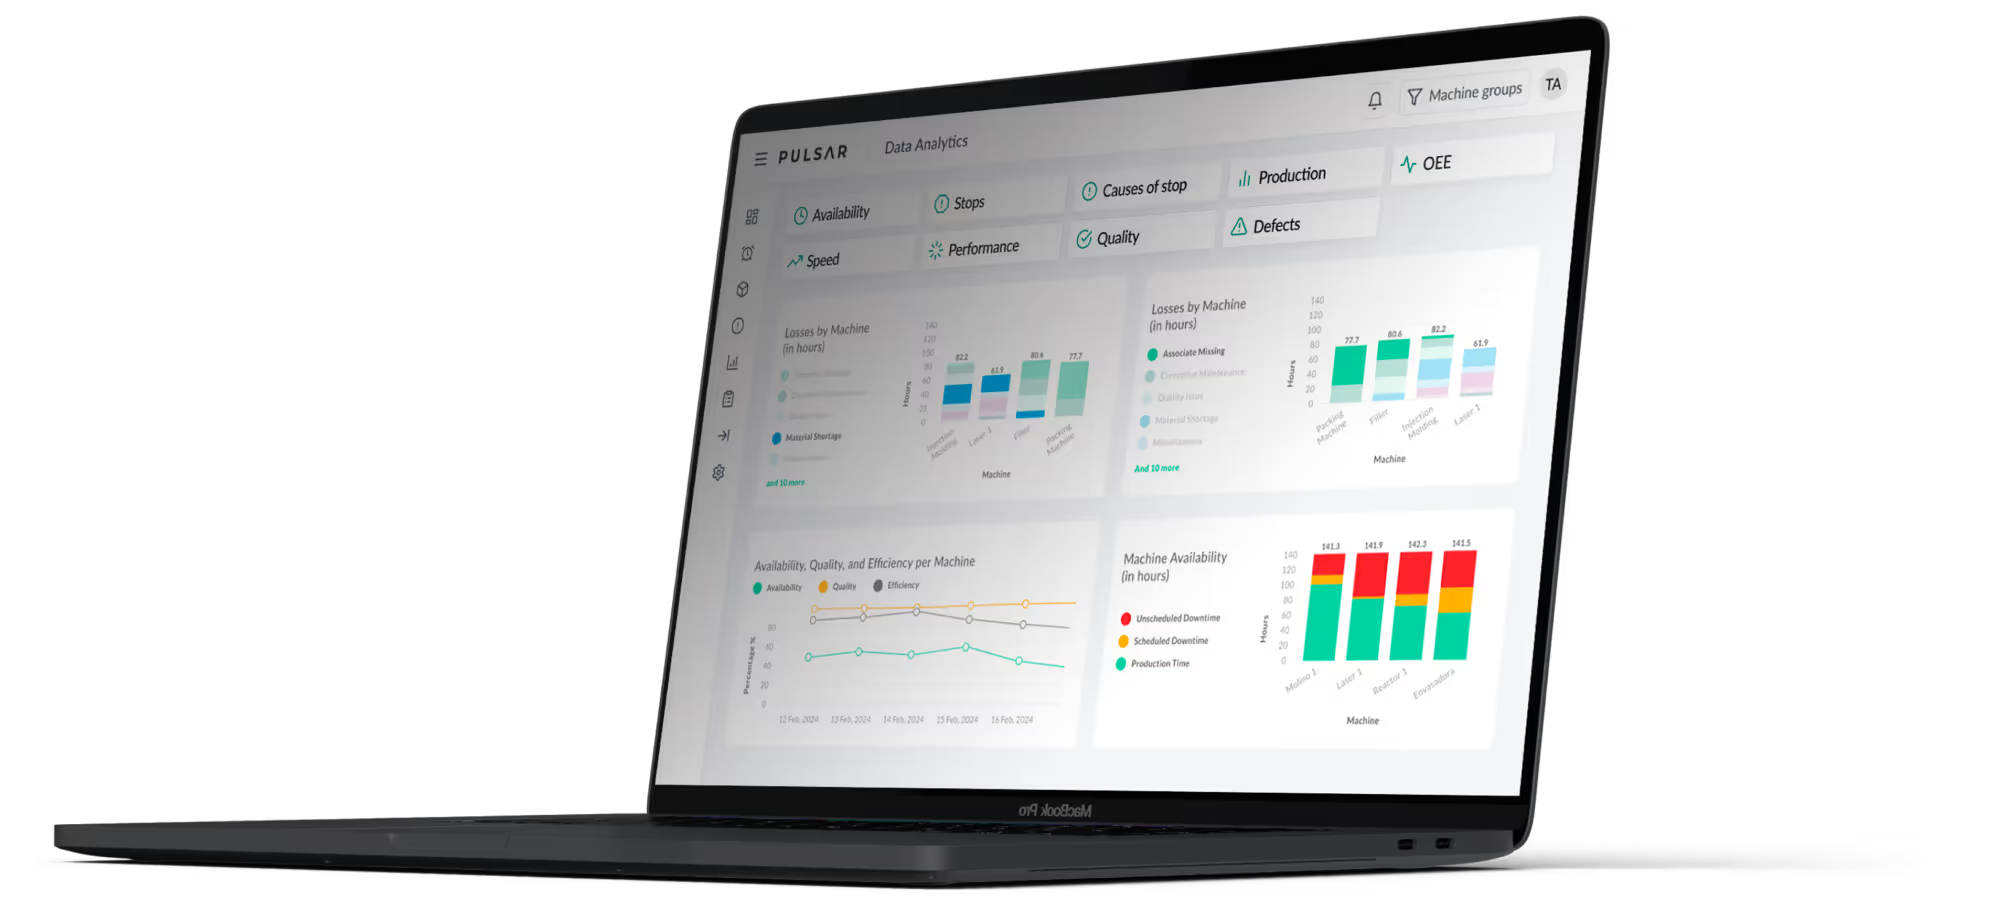
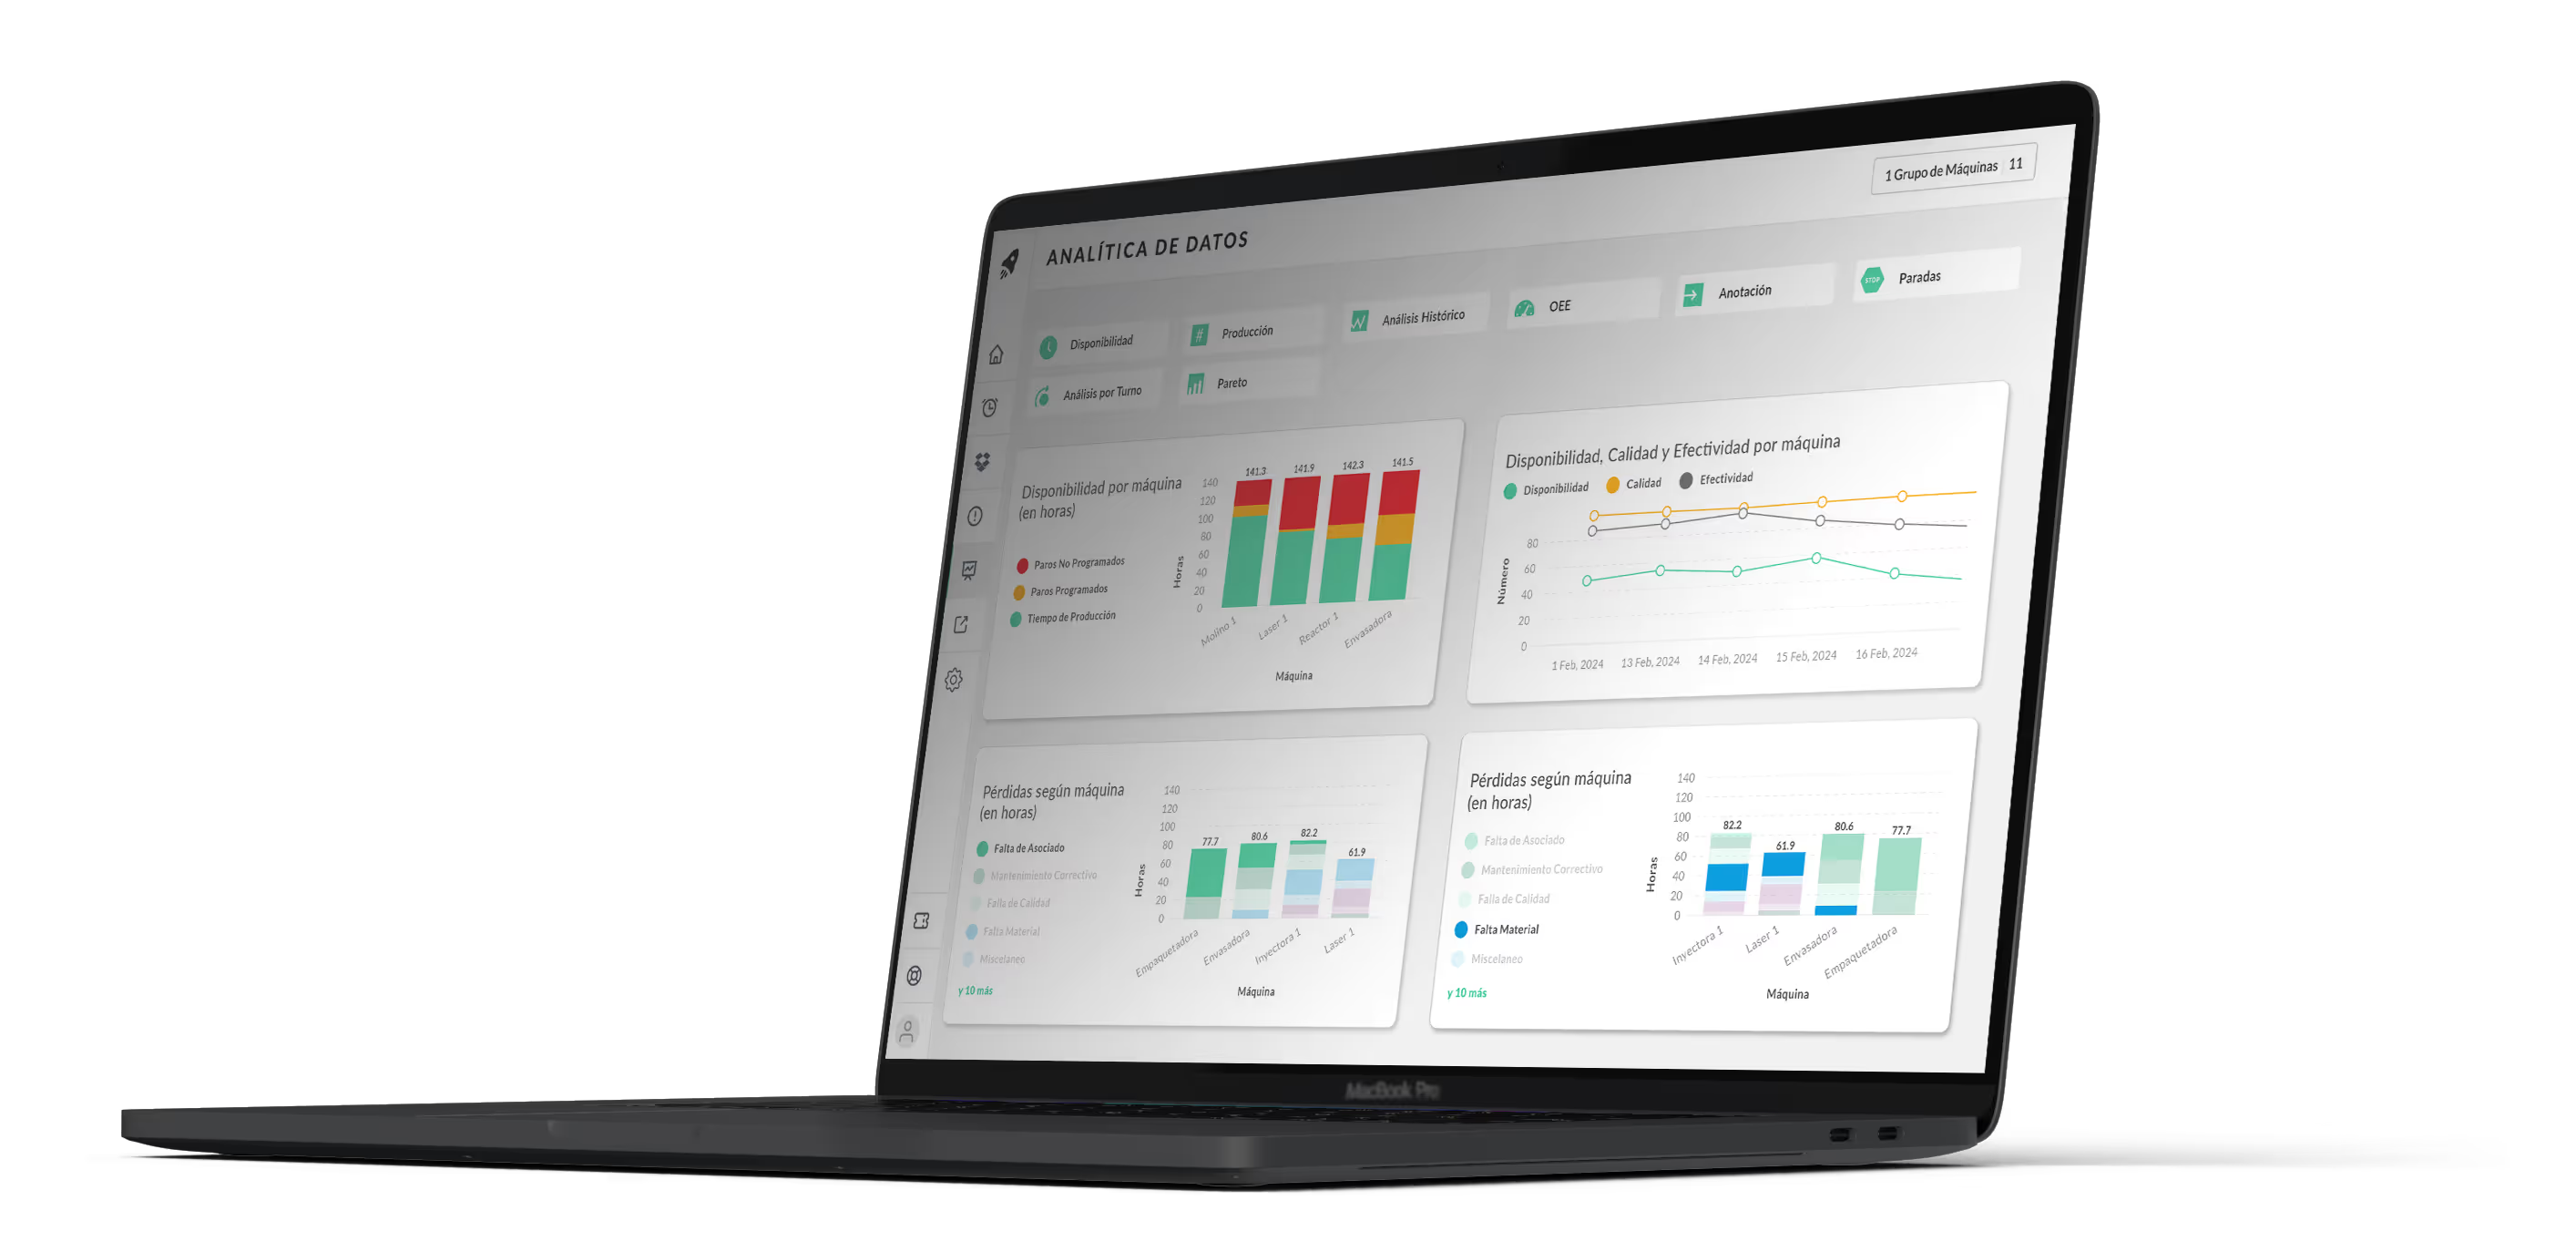
Pulsar lets you check production, availability, speed, cycles, machine stops, OEE, and over 25 other metrics from dashboards you can view on a laptop, smartphone, tablet, or screens on the shop floor.
Reports and analytics
With information that's collected automatically, historical and advanced analytics reports let you compare machines, shifts, lines, and periods to recognize patterns and evaluate the results of an improvement action.
Alerts and indicators
Alerts by email, WhatsApp, or push notification tell the responsible teams about relevant events, such as machine stops. They're configurable to each company's needs and to how you track each machine or process.
Scalability and connection
Pulsar can bring machines of different brands and generations into a single monitoring environment. This lets you cover different manufacturing processes and consolidate operational data in one platform.
It can also connect with other systems through API integrations. The scope of each connection depends on the infrastructure and the project's needs.
Ready to transform your company?
As we've covered, improving manufacturing productivity isn't only about adding new technology or replacing machines. It takes consistent data, coordination across areas, and follow-up on the changes you put in place.
Visibility, digitization, and reporting can strengthen and improve processes on the machines you already have. That way, production teams can weigh where to act before deciding whether to replace or expand their machines.
Explore the Pulsar industrial platform and see how to monitor your machines, centralize indicators, and support improvement efforts with real operating data.
Frequently asked questions
Which manufacturing technologies and Industry 4.0 innovations help increase manufacturing productivity?
Industrial sensors, IoT devices, real-time monitoring, dashboards, automatic reports, alerts, and APIs can add visibility and make coordination easier. They support many use cases and can reshape how you manage production toward smart manufacturing. That's the case with Pulsar, a manufacturing intelligence platform that uses modern technology to help companies drive productivity.
Which processes should you digitize first in a plant?
It's best to start with work processes that take too much time or keep you from knowing the state of the operation. Improving a plant's visibility is one of the critical projects for growth and productivity.
Examples of processes that can improve plant visibility include monitoring indicators, tracking production, better capture of machine stops, visual management of indicators, better report generation and handling, and reviewing historical data. Platforms like Pulsar offer many of these features to help you digitize processes, add visibility, and drive productivity on the floor.
How do automatic reports help improve productivity?
Automatic reports keep factory operation data up to date across indicators and reduce the work needed to consolidate information. They also let you compare periods, recognize trends, and check whether an improvement action changed how a machine or process behaves, with information that's current to the moment. Automatic report generation lets you analyze faster, on the spot, without spending hours processing data. For example, you can see a shift's performance as soon as it ends and compare it against shifts on the same machine over the year.
What are the benefits of integrating ERP, MES, and monitoring platforms?
Connecting these systems can tie planning to execution and the machines' real performance, and give more complete visibility into what's happening in operations. It also helps you run deeper analysis on production, performance, and customer orders. And it can also make information easier to review and provide a more consistent reference across production, sales, planning, and management.
Is it possible to implement Industry 4.0 technology on existing machinery?
Yes, it is. Industrial sensors, relays, cameras, and other external devices let you capture data from machines that weren't designed to connect to other systems. Platforms like Pulsar use these automated data capture devices to connect to existing machines, both old and modern, through Industry 4.0 technology.
Related articles
Request a Custom Demo
See how Pulsar’s manufacturing intelligence platform can help your operations today.