OEE Management Software: Improve your Operational Efficiency
Pulsar's OEE Management Software is built to give plant managers and operations leaders visibility of their daily operations, regardless of their machines types or lines. With our platform, you can leverage real-time insights that help your production team move faster, make better decisions, and improve operational efficiency. No need to replace your existing equipment, and no PLC needed.
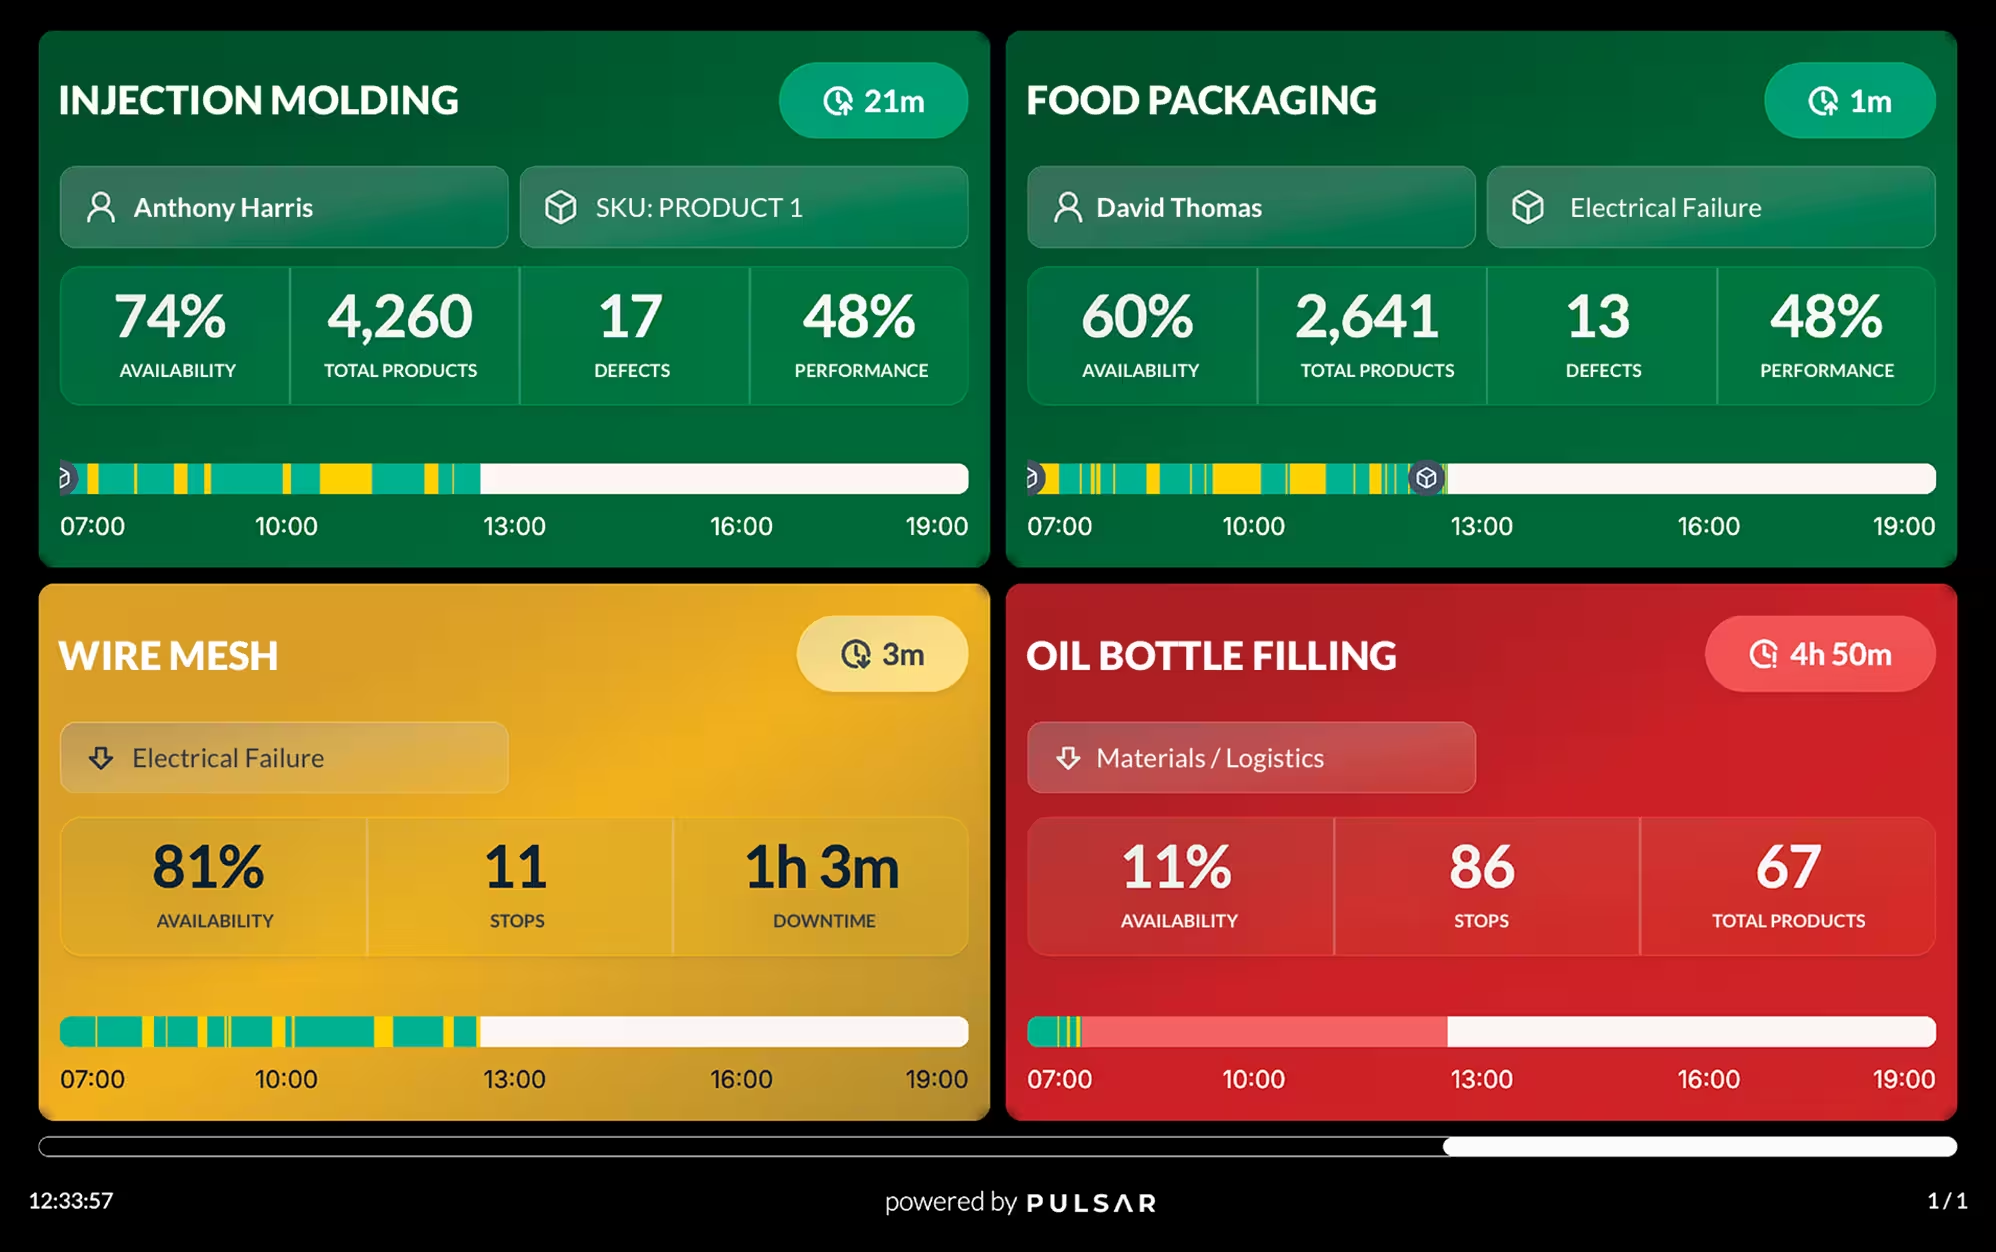

Improve manufacturing efficiency with an OEE software
Pulsar brings your operational efficiency metrics into a single monitoring platform, keeping your entire team aligned.
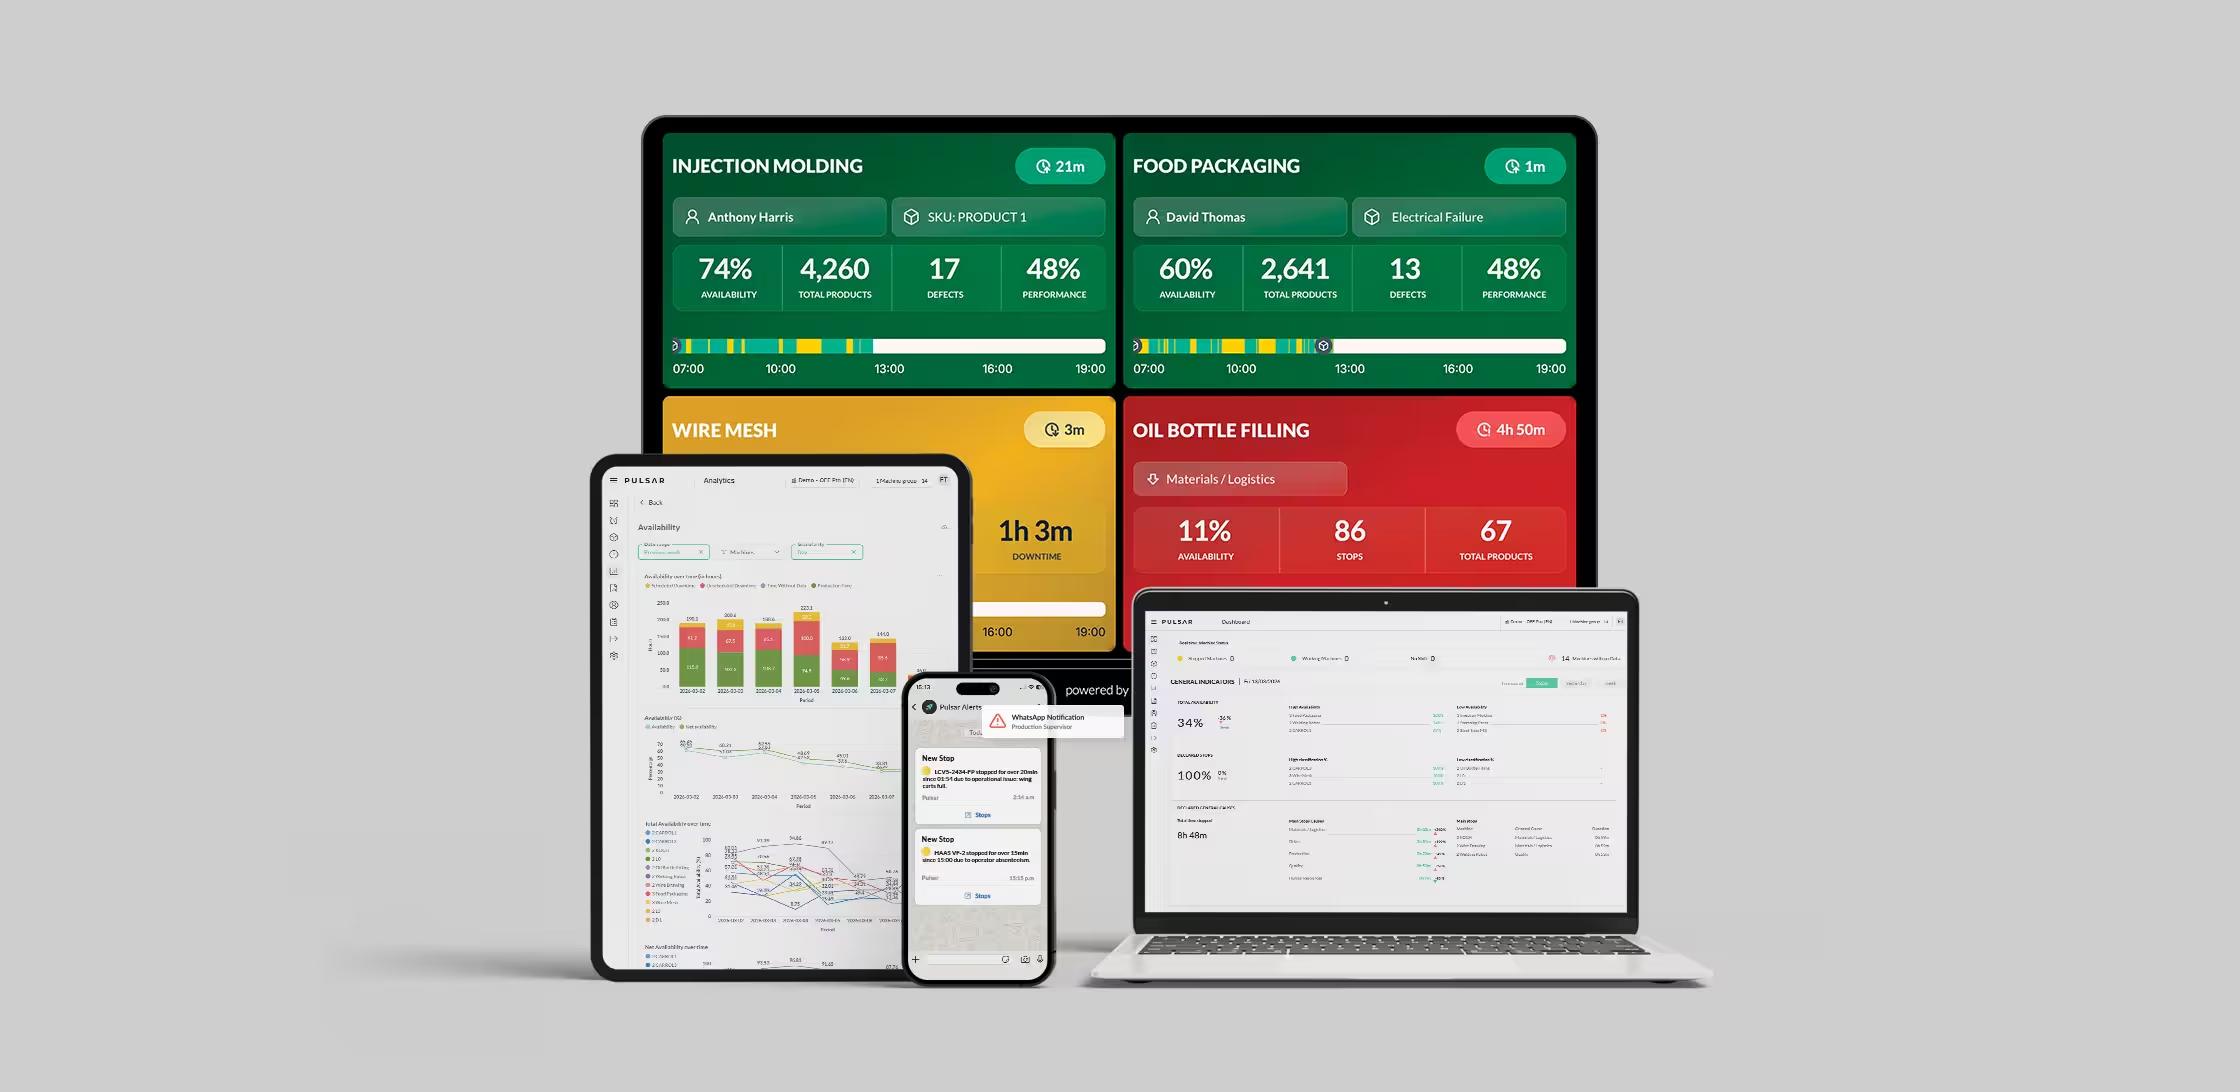
Automated tracking of operational efficiency metrics: OEE, downtime, speed, production, and 25+ KPIs.
Digital Andon with customizable alerts to detect and escalate problems with agility.
Advanced analytics and automated reports to identify patterns and improve processes.
What is an OEE Management Software?
In addition to being a tracking tool, an OEE Management Software acts as a strategic layer that enables directors and managers to manage their operational efficiency across machines, shop floors, and plants. With this type of solution, you can:
- Know when, where, and for how long machines are down.
- Identify the most frequent causes of downtime through automated reports and historical analysis.
- Compare performance across machines, lines, shifts, or plants to prioritize improvement opportunities.
- Support continuous improvement initiatives with reliable indicators such as OEE, availability, and downtime.
Tracking OEE and operational efficiency metrics show you where your production needs improvement. But most of the time knowing the problem isn't enough. Managing OEE means setting specific goals for each loss category, assigning accountability, and adjusting processes based on your operational data. Plants that actively manage OEE use their data to make decisions that increase profitability and competitiveness. The difference is moving from measurement to action.
By replacing manual tracking with automated insights on OEE analytics, Pulsar helps operations directors and plant managers make decisions based on facts, not assumptions. This includes real-time machine monitoring and key productivity metrics, which add both confidence and impact into process optimization efforts. With precise data of machine performance, manufacturing companies can lead smarter, act faster, and improve continuously.

Improving Manufacturing Efficiency: Common Challenges
Automated OEE analytics
Inject agility into your operations with Pulsar, powered by the latest Industry 4.0 technology. We connect to machines and production lines using non-invasive industrial sensors to automatically capture real-time machine data and OEE analytics, without relying on manual logging. With Pulsar, you can regain control of your shop floor with clarity and accuracy.
Why Leaders Trust Pulsar for OEE Analytics
Effective OEE management requires reliable information available the moment an event happens, not at the end of the shift. Pulsar integrates machine monitoring, automatic data logging, and OEE analytics to support plants in reducing machine downtime and increasing factory visibility.
Operational clarity
Our platform enables visibility in real-time of your production, downtime, and machine performance, as well as OEE analytics, with minimal setup.


Designed for agile management
Our OEE software with custom reporting and alerts enables your team to act on problems the moment they happen, not hours later.
Reliable operational efficiency metrics
Manage goals and metrics aligned with what’s actually happening on the floor. Stop relying on your operators and their memory to improve your manufacturing efficiency.

How OEE Management Software Supports Process Optimization
If your goal is to improve processes and manage operations effectively, you need timely and reliable information about what's happening on your shop floor. Today there are essential tools that allow you to manage downtime and OEE more consistently, stay on top of problems in real time, and drive reduction in production downtime. Examples of tools that shouldn't be missing from your plant:
- Downtime tracking and root cause analysis
- Historical analytics and trend reporting
- Customizable dashboards and digital Andon
- Automated performance metrics for process optimization
- Machine monitoring system
Having precise, automated OEE tracking and OEE analytics directly from your machines allows you to stay on top of the issues. No more digging through logs or playing catch-up across the plant. If your objective is to improve your processes and manage operations to improve, you need timely, accurate information on what’s happening on the shop floor.
This not only makes your efforts relevant and highly targeted, but also helps you to align your team on what really matters: performance and quality.
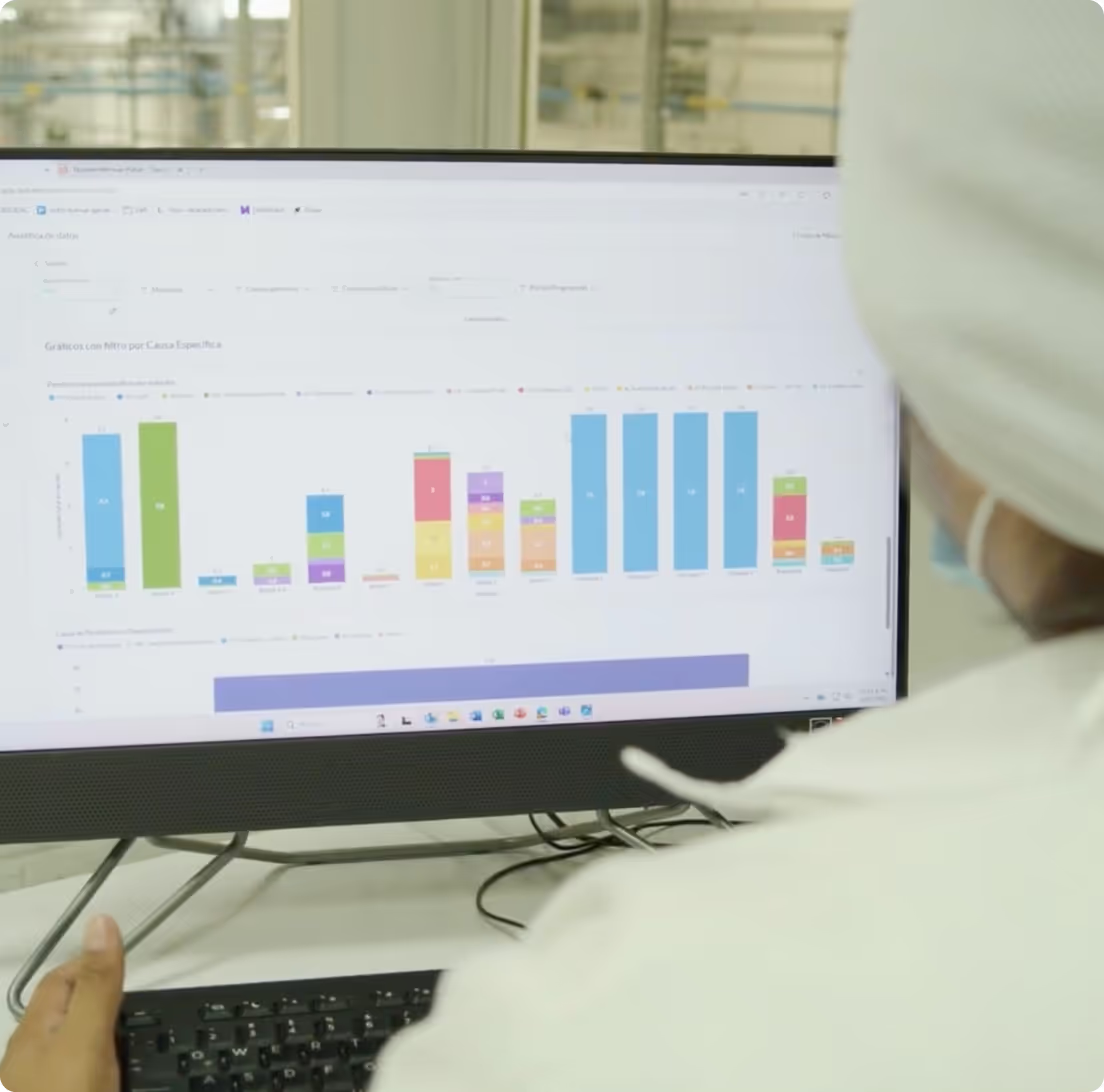
Managing automated OEE for a wide range of Manufacturing sectors

Doypack, case packers, canning machines, baggers, and more.

Liquid fillers for food, chemicals, and beverages.

Injection molding, blow molding, thermoforming, extrusion, recycling, and more.

Presses, benders, welders, punch presses, laser cutters, and more.

Welders, shears, benders, presses, aluminum injectors, and more.

Assembly, glass, electronics, textiles, printing, and more.
How we benefit our clients
Results achieved by our clients using our OEE management software.







Improve manufacturing efficiency and drive growth with Pulsar
Pulsar helps you to optimize processes for greater manufacturing efficiency. Achieve higher monitoring automation with our solutions.

Enable real-time monitoring for any machine—regardless of type, model, or age, without interfering PLCs.

We collect data automatically and make it accessible to your team from a single, intuitive platform.

Our platform can be installed in a single visit, requires minimal setup, and includes technical support.
Frequently Asked Questions
Pulsar uses sensors, smart cameras, and data capture devices to measure OEE, machine stops, micro-stops, speed, cycles, production, performance, and 25+ key metrics directly from the machines. You can install this technology on machines of any brand or age without touching the PLC.
All the data flows into one platform where you can monitor and compare machines, shifts, and time periods. This makes it easy to spot inefficiencies and see where your biggest production losses build up.
The first step is capturing when each machine stop starts and ends. Operators can then log or confirm the cause with digital notes or forms. This way, your team no longer relies on paper notes or on memory at the end of the shift.
With Pulsar's machine monitoring system, you can detect planned and unplanned machine stops automatically. Operators can classify downtime causes in just a couple of clicks. Historical reports help you analyze patterns and trends, so you can drive continuous improvement and process optimization projects.
The main KPIs are total downtime, total stop duration, stop frequency, number of stops, average time per event, stop cause, and machine availability. It also helps to analyze production, speed, performance, and OEE to understand how downtime affects each shift's results.
The best practice is to analyze and compare these KPIs by machine or line, shift, and time period. A single monthly total can hide important differences. For example, it won't show whether your downtime comes from one long stop or from many short interruptions.
To reduce machine downtime, first identify where machine stops happen, how long they last, and which ones repeat most often. Then prioritize the events that add up to the most lost time or affect your critical machines.
Automated production monitoring gives you a reliable foundation for root cause analysis. You can compare results over time or across machines, define optimization actions, and confirm whether your improvements actually cut the duration or frequency of machine stops.
Micro-stops are short, recurring interruptions that often go unnoticed in manual records. Each event may last only a few seconds or minutes. Over a shift, though, they add up. They lower your effective speed, hurt performance, and make it harder to hit your targets.
Automatic measurement shows you which machines have the most micro-stops, when they happen, and how much productive time they cost you in total. Automatic detection is also more accurate than observation, since it can catch stops that last only a few seconds.
Downtime mainly affects availability, one of the three key components of OEE. If a machine can't run during its scheduled shift time, its efficiency drops.
Reducing downtime is a key step in any process optimization or continuous improvement project. This applies to both planned stops (such as setups, calibrations, and maintenance) and unplanned stops (such as mechanical failures, absent operators, and power outages).
Making better use of machine time helps manufacturing companies raise efficiency. To get there, analyze the duration, frequency, and causes behind your losses. That shows you what's affecting each machine's performance and which corrective actions to take.

Request a custom demo
Discover how our OEE Management Software can help you to optimize your manufacturing processes.